Copy Number Segments Plot
focal_cn_plot.RdGenerates a plot of all CN segments for a specified region.
focal_cn_plot(
  region,
  gene,
  these_samples_metadata,
  this_seq_type = "genome",
  type = "gain",
  segment_size = 1,
  crop_segments = TRUE,
  sort_by_annotation = c("pathology"),
  crop_distance = 1e+08
)
Arguments
- region
Genomic region for plotting in bed format.
- gene
Optional variable, converts gene to region if region not supplied.
- these_samples_metadata
Required parameter. GAMBL metadata subset to the cases you want to process (or full metadata).
- this_seq_type
Seq type for returned CN segments. One of "genome" (default) or "capture".
- type
Type of CN segment to be plotted. Default is gain (CN > 2).
- segment_size
This parameter controls the size of the segment plotted with ggplot2, default is 1.
- crop_segments
Boolean statement that crops segment by first checking if crop segment is smaller than lef/right distance, then adds or subtracts crop distance to end/start coordinates. Default is TRUE.
- sort_by_annotation
Sort CN by annotation, default is "pathology".
- crop_distance
Crop distance for cropping segments. Default value is 10000000 bp.
Value
Nothing
Details
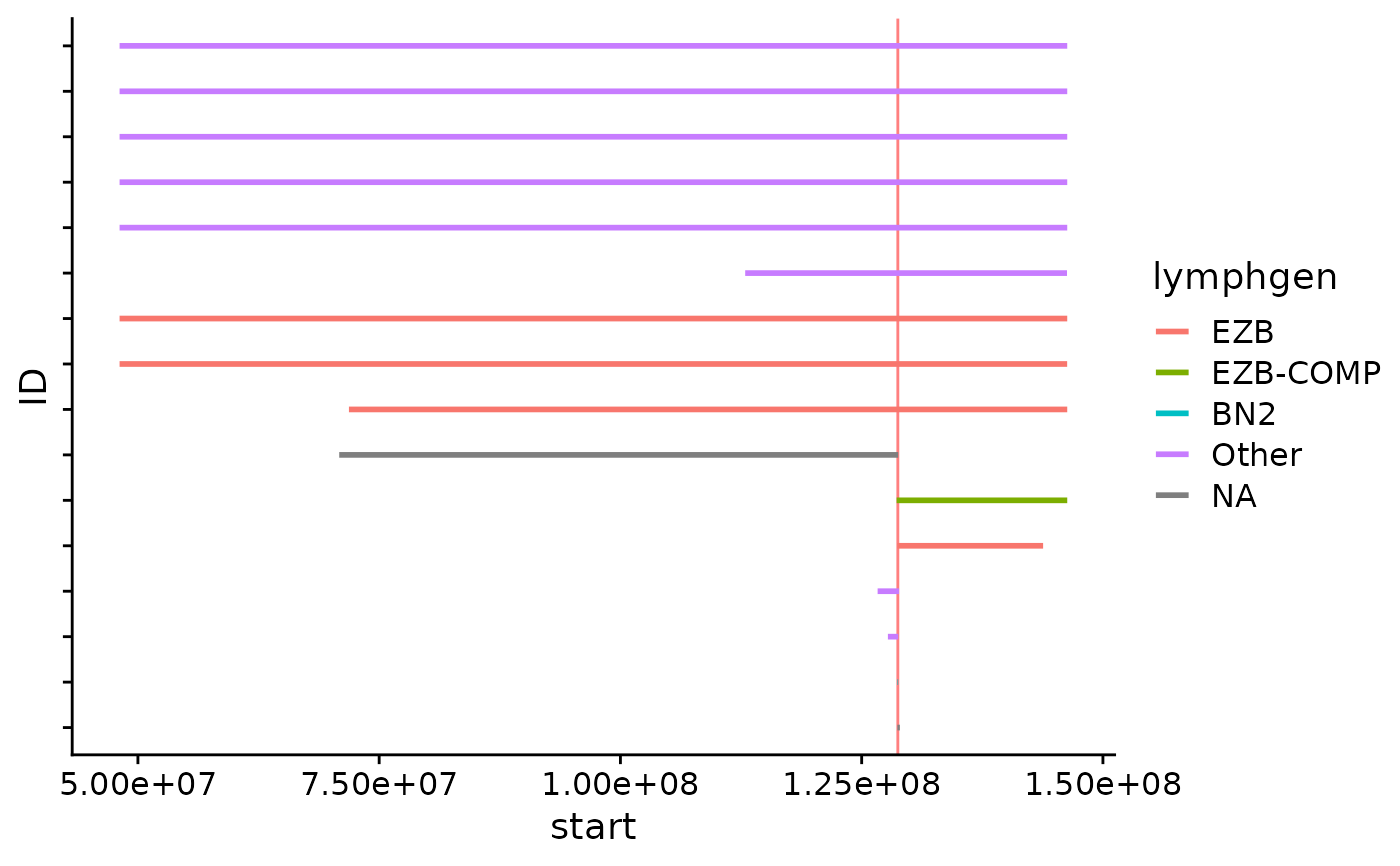
This function visualizes all CN segments for a defined region, colours the returned segments based on lymphgen information.
In addition, this function takes either a specified region (chr:start-end format). If no region is supplied, the user can give the function a gene symbol
with gene. If so, the function will internally retrieve the region for the specified gene.
Sample IDs are specified along the y-axis and the genomic position is visualized along the x-axis.
Examples
#get metadata
this_metadata = get_gambl_metadata()

#get myc region
myc_region = gene_to_region(gene_symbol = "MYC",
                            return_as = "region")
#> 1 region(s) returned for 1 gene(s)

#build plot
focal_cn_plot(these_samples_metadata = this_metadata,
              region = myc_region,
              type = "loss",
              crop_distance = 100000000)