Oncooplot
prettyOncoplot.RdCreate a highly customizable oncoplot.
prettyOncoplot(
  maftools_obj,
  onco_matrix_path,
  genes,
  include_noncoding = NULL,
  keepGeneOrder = FALSE,
  keepSampleOrder = TRUE,
  highlightHotspots = FALSE,
  these_samples_metadata,
  metadataColumns,
  numericMetadataColumns,
  expressionColumns = c(),
  numericMetadataMax,
  sortByColumns,
  arrange_descending = FALSE,
  removeNonMutated = FALSE,
  minMutationPercent,
  mutAlpha = 1,
  recycleOncomatrix = FALSE,
  splitColumnName,
  splitGeneGroups,
  showTumorSampleBarcode = FALSE,
  groupNames,
  hide_annotations,
  annotate_specific_genes = FALSE,
  this_forest_object = NULL,
  custom_colours = NULL,
  hideTopBarplot = TRUE,
  tally_all_mutations = FALSE,
  tally_all_mutations_max = 1000,
  hideSideBarplot = FALSE,
  box_col = NA,
  annoAlpha = 1,
  legend_direction = "horizontal",
  ylim = NULL,
  legend_position = "bottom",
  legend_row = 3,
  legend_col = 3,
  metadataBarHeight = 1.5,
  metadataBarFontsize = 5,
  legendFontSize = 10,
  fontSizeGene = 6,
  annotation_row = 2,
  annotation_col = 1,
  verbose = FALSE
)
Arguments
- maftools_obj
A maftools object containing the mutations you want to plot.
- onco_matrix_path
Provide a path to an onco_matrix file instead of a MAF object if the former is unavailable (this limits functionality a bit).
- genes
An optional vector of genes to restrict your plot to.
- include_noncoding
List of non-coding regions to be included, default is NULL. Specify like this: include_noncoding=list("NFKBIZ" = c("3'UTR"), "HNRNPH1" = "Splice_Region")
- keepGeneOrder
Set to TRUE if you want to preserve the gene order specified.
- keepSampleOrder
Set to TRUE if you want to preserve the sample order specified.
- highlightHotspots
Set to TRUE to highlight hot spots. Default is FALSE.
- these_samples_metadata
Data frame containing metadata for your samples.
- metadataColumns
A vector containing the categorical column names you want to plot below.
- numericMetadataColumns
A vector containing the numeric columns you want to plot below.
- expressionColumns
Optional variable for retreiving expression values for a specific gene(s).
- numericMetadataMax
A numeric vector of cutoffs to apply to numeric columns above.
- sortByColumns
A vector containing the column names you want to sort columns (patients) on.
- arrange_descending
A Boolean parameter. Set to TRUE to sort metadata in descending fashion. Default is FALSE.
- removeNonMutated
Set to TRUE to drop unmutated cases.
- minMutationPercent
Only genes mutated in more than minMutationPercent % patients will be included.
- mutAlpha
Optional alpha to apply to mutation colours.
- recycleOncomatrix
Set to TRUE most of the time to reuse the oncomatrix saved by maftools.
- splitColumnName
Optional argument to indicate which metadata column to split on. Default is set to pathology.
- splitGeneGroups
Split genes into groups for better seperation (between different gene-groups) in prettyOncoplot.
- showTumorSampleBarcode
Optional argument for showing tumor barcode. Default is FALSE.
- groupNames
optional vector of group names to be displayed above heatmap. Should be the same length as the number of groups that will be shown. Default is NULL (no labels).
- hide_annotations
Hide annotations for specifc ashms. argument takes a list with annotations.
- annotate_specific_genes
Optional argument, specifying whether the features should be labelled according to their significance in one of the pathologies. Default is FALSE (no annotation).
- this_forest_object
If annotate_specific_genes is specified, this arguments takes the output of GAMBLR::prettyForestPlot directly to determine the annotations.
- custom_colours
Provide named vector (or named list of vectors) containing custom annotation colours if you do not want to use standartized pallette.
- hideTopBarplot
Optional argument for removing top bar plot. Default value is TRUE.
- tally_all_mutations
Optional argument. Set to TRUE to tally all mutations. Default is FALSE.
- tally_all_mutations_max
Optional argument. Default is 1000.
- hideSideBarplot
Optional argument for removing side bar plot. Default value is FALSE.
- box_col
Colour of boxes for outlining mutations (can be problematic with larger oncoprints).
- annoAlpha
Optional alpha to apply to annotation colours.
- legend_direction
Direction of lgend, defualt is "horizontal".
- ylim
Limit for y-axis.
- legend_position
Position of legend, default is "bottom".
- legend_row
Fiddle with these to widen or narrow your legend.
- legend_col
Fiddle with these to widen or narrow your legend.
- metadataBarHeight
Optional argument to adjust the height of bar with annotations. The default is 1.5.
- metadataBarFontsize
Optional argument to control for the font size of metadata annotations. The default is 5.
- legendFontSize
Font size for legend, default is 10.
- fontSizeGene
Font size for gene labels (default 6).
- annotation_row
Row for annotations, default is 2.
- annotation_col
Column for annotations, default is 1.
- verbose
Set to TRUE to enable verbose mode (debugging messages.
Value
Nothing
Details
Make an oncoplot that is pretty using ComplexHeatmap. The metadata is expected to follow the structure and column naming used in GAMBL. If you provide your own non-GAMBL samples and metadata, you must include at least the following columns with these names. The first one should match the Tumor_Sample_Barcode in the MAF object or onco_matrix you provide. sample_id, pathology
Examples
library(grid)
#get some data
maf_data = get_coding_ssm(seq_type = "genome")
#> reading from: /projects/nhl_meta_analysis_scratch/gambl/results_local/all_the_things/slms_3-1.0_vcf2maf-1.3/genome--projection/deblacklisted/augmented_maf/all_slms-3--grch37.CDS.maf
#> mutations from 1652 samples
#> after linking with metadata, we have mutations from 1646 samples
maf_metadata = get_gambl_metadata()
maf = maftools::read.maf(maf_data, clinicalData = maf_metadata)
#> -Validating
#> --Removed 1078 duplicated variants
#> -Silent variants: 65357
#> -Summarizing
#> --Possible FLAGS among top ten genes:
#> TTN
#> -Processing clinical data
#> -Finished in 34.4s elapsed (00:01:04 cpu)
#define some genes of interest
bl_genes = c("NFKBIZ", "ID3", "TP53", "ARID1A", "FBXO11",
"GNA13", "TCF3", "TFAP4", "HNRNPU", "FOXO1",
"CCND3", "SMARCA4", "DDX3X")
dlbcl_genes = c("EZH2", "KMT2D", "MEF2B", "CREBBP", "MYD88")
genes = c(bl_genes, dlbcl_genes)
#define gene groups
gene_groups = c(rep("BL", length(bl_genes)), rep("DLBCL", length(dlbcl_genes)))
names(gene_groups) = genes
#filter metadata
maf_metadata = dplyr::filter(maf_metadata,!lymphgen %in% c("COMPOSITE"))
#convert metadata column into factor
maf_metadata$pathology = as.factor(maf_metadata$pathology)
#define order of factors for selected metadata column
maf_metadata$pathology = factor(maf_metadata$pathology,
levels = c("DLBCL", "BL",
"B-ALL", "CLL",
"COMFL", "DLBCL-BL-like",
"FL", "HGBL",
"MCL", "PBL",
"SCBC", "UNSPECIFIED"))
maf_metadata = with(maf_metadata, maf_metadata[order(pathology),])
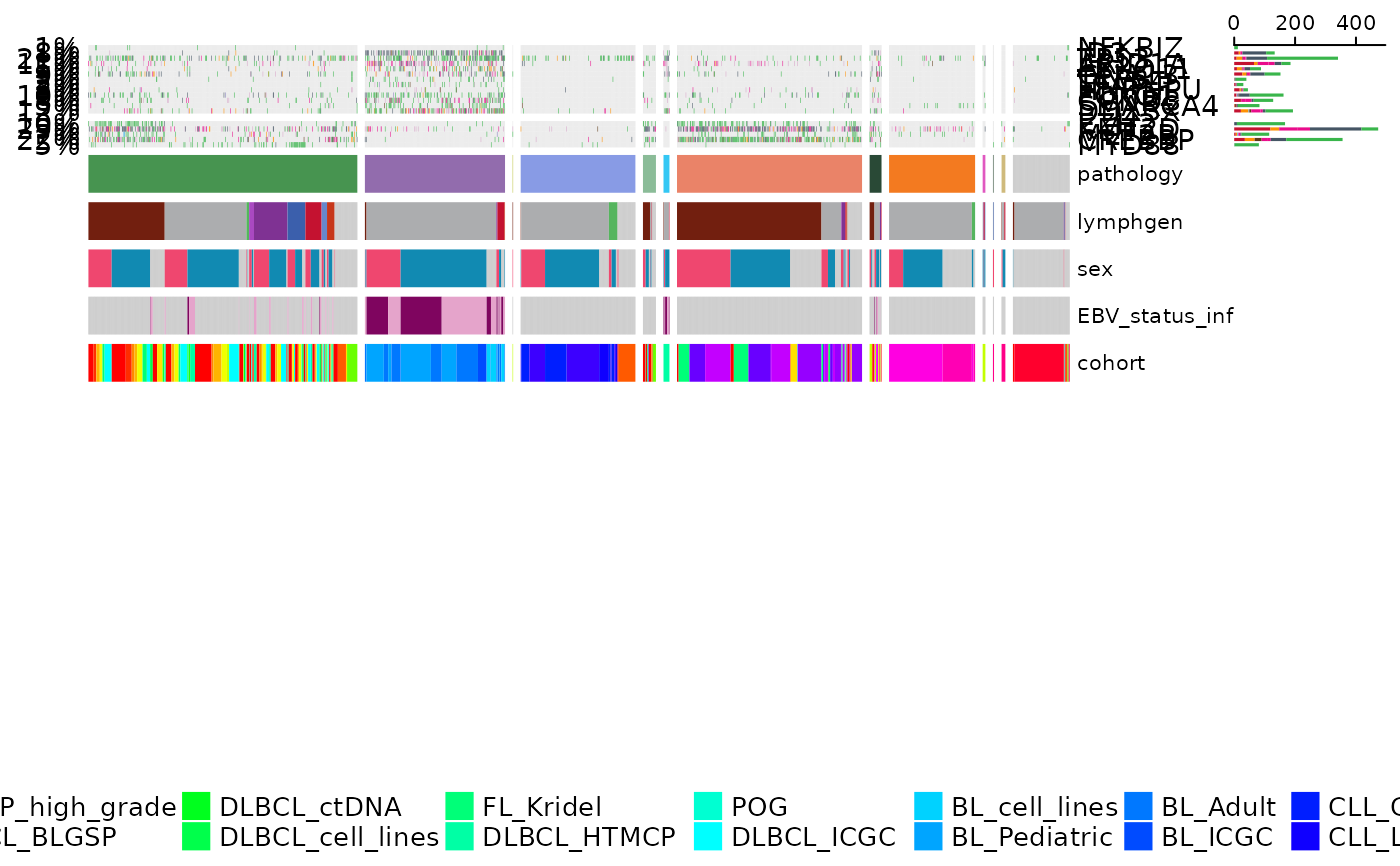
#create prettyOncoplot
prettyOncoplot(maftools_obj = maf,
genes = genes,
these_samples_metadata = maf_metadata,
splitGeneGroups = gene_groups,
keepGeneOrder = TRUE,
splitColumnName = "pathology",
metadataBarHeight = 5,
metadataBarFontsize = 8,
legend_row = 2,
fontSizeGene = 11,
metadataColumns = c("pathology", "lymphgen", "sex", "EBV_status_inf", "cohort"),
sortByColumns = c("pathology", "lymphgen", "sex", "EBV_status_inf", "cohort"))
#> [1] "numcases: 1646"
#> [1] "numgenes: 18"
#> All mutation types: Frame_Shift_Del, Missense_Mutation, Multi_Hit,
#> Splice_Site, Nonsense_Mutation, Frame_Shift_Ins, In_Frame_Del,
#> Translation_Start_Site, Nonstop_Mutation, In_Frame_Ins.
#> `alter_fun` is assumed vectorizable. If it does not generate correct
#> plot, please set `alter_fun_is_vectorized = FALSE` in `oncoPrint()`.
#> Following `at` are removed: RNA, 3'UTR, Splice_Region, Silent,
#> hot_spot, because no color was defined for them.
#> Following `at` are removed: RNA, 3'UTR, Splice_Region, Silent,
#> hot_spot, because no color was defined for them.
#> Following `at` are removed: RNA, 3'UTR, Splice_Region, Silent,
#> hot_spot, because no color was defined for them.