Total n variants count plot.
fancy_v_count.RdGenerate a bar plot visualizing total variant (SSM or SVs) count for selected contigs.
fancy_v_count(
  this_sample_id,
  maf_data,
  maf_path = NULL,
  ssm = TRUE,
  projection = "grch37",
  this_seq_type = "genome",
  min_vaf = 0,
  variant_type_col = 10,
  chromosome_col = 5,
  plot_title = paste0(this_sample_id),
  plot_subtitle = "Variant Count For Selected Contigs",
  chr_select = paste0("chr", c(1:22)),
  variant_select = c("DEL", "INS", "DUP"),
  snp_colours = c(SNP = "#2B9971", DNP = "#993F2B", TNP = "#A62656"),
  hide_legend = FALSE,
  coding_only = FALSE,
  log10_y = FALSE,
  from_flatfile = TRUE,
  use_augmented_maf = TRUE
)
Arguments
- this_sample_id
Sample to be plotted.
- maf_data
Optional parameter with maf like df already loaded into R.
- maf_path
Optional parameter with path to external maf like file.
- ssm
Set to FALSE to get plotting data from get_combined_sv (SVs). Default value is TRUE (plots SSM retrieved from annotate_cn_by_ssm$maf).
- projection
Genome build for returned variants (only applicable for ssm = FALSE).
- this_seq_type
Seq type for returned CN segments. One of "genome" (default) or "capture".
- min_vaf
The minimum tumour VAF for a SV to be returned. Recommended: 0 (only applicable for ssm = FALSE).
- variant_type_col
Index of column holding Variant Type (to be used with either maf_data or maf_path).
- chromosome_col
Index of column holding Chromosome (to be used with either maf_data or maf_path).
- plot_title
Title of plot (default to sample ID).
- plot_subtitle
Subtitle for created plot.
- chr_select
vector of chromosomes to be included in plot, defaults to autosomes.
- variant_select
Subtypes of SVs to be included in plot, default is DEL, INS and DUP.
- snp_colours
Optional vector with colours for SNPs (DNP and TNP).
- hide_legend
Set to True to remove legend from plot, default is FALSE.
- coding_only
Optional. Set to TRUE to restrict to plotting only coding mutations.
- log10_y
Set to TRUE to force y axis to be in log10.
- from_flatfile
If set to true the function will use flat files instead of the database.
- use_augmented_maf
Boolean statement if to use augmented maf, default is TRUE.
Value
A plot as a ggplot object (grob).
Details
This function creates a barplot showing the total number of variants for a selected sample.
Convenience parameters for restricting the returned plot are available. For example, with ssm (Boolean)
you can toggle if the plot will be in respect to SSM (ssm = TRUE) or if you wish to count SVs (ssm = FALSE).
In addition, this plot can also accept a variety of incoming data types. Either, you supply the function with a sample ID
(this_sample_id) and the function will retrieve data using assign_cn_to_ssm or get_combined_sv (depending on how the ssm parameter is used).
This function also supports a maf or maf-like data frame directly, this is done with maf_data or maf_path. If data is supplied with either of these parameters,
the user can specify what column holds the variant type information as well as chromosome information (variant_type_col and chromosome_col).
Restricting the plot to coding mutations is done with coding_only = TRUE. Flat-file and augmented maf options can be toggled with from_flatfile
and use_augmented_maf. Both are TRUE by default and should rarely be set to FALSE. Lastly, this plotting function also have convenient parameters for
customizing the returned plot, e.g plot_title, y_interval, hide_legend, andplot_subtitle and snp_colours. lastly, it is also possible
to control what variants are to be counted with variant_select. Default is deletions, insertions and duplications, c("DEL", "DUP", "INS"). Not that
the variant types specified in this parameter must match with whatever is present in the corresponding variant_type_col.
Examples
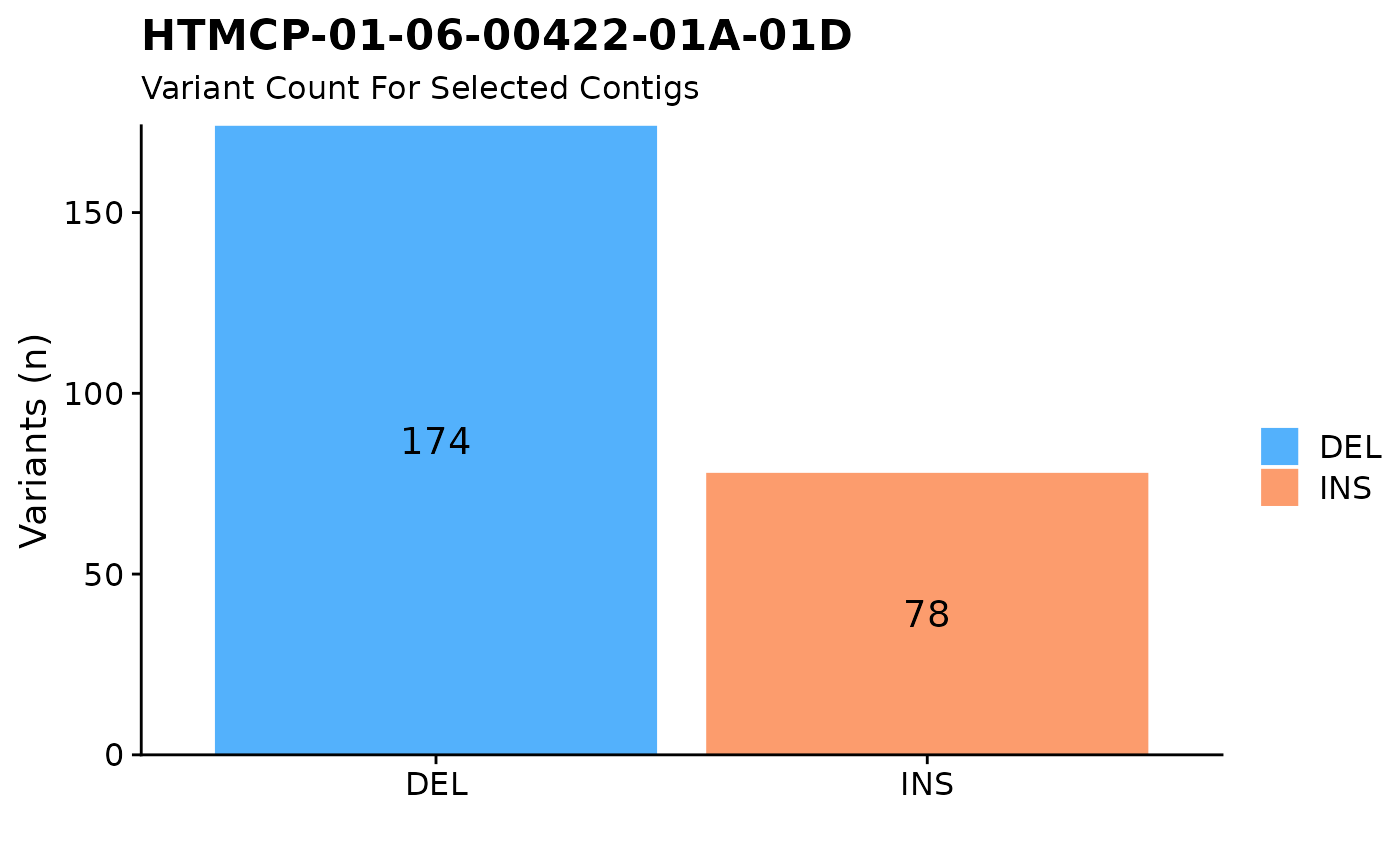
#count all variants for one sample (default parameters)
fancy_v_count(this_sample_id = "HTMCP-01-06-00422-01A-01D")
#> trying to find output from: battenberg
#> looking for flatfile: /projects/nhl_meta_analysis_scratch/gambl/results_local/gambl/battenberg_current/99-outputs/seg/genome--projection/HTMCP-01-06-00422-01A-01D--HTMCP-01-06-00422-10A-01D--matched.battenberg.grch37.seg
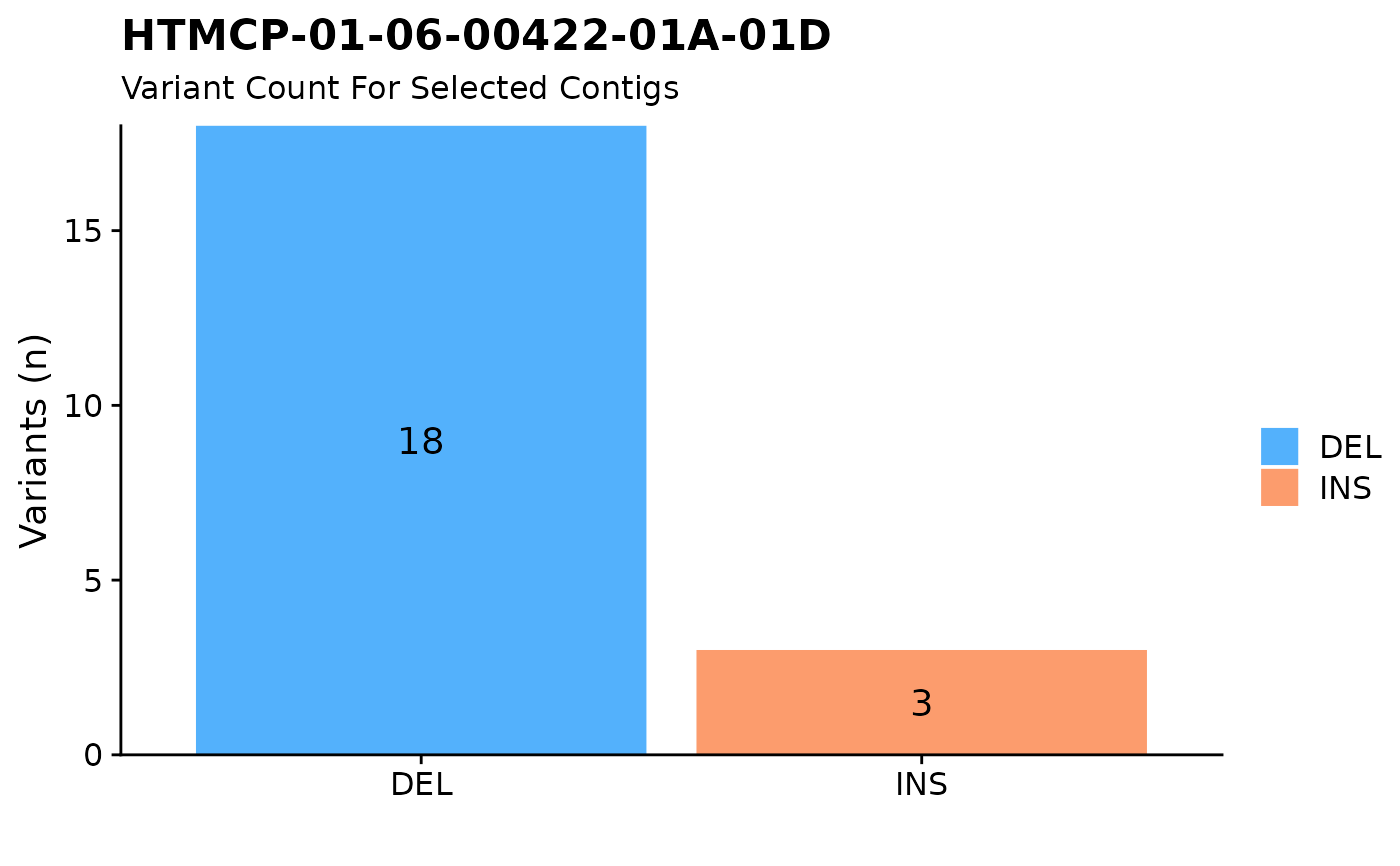
 #count and plot all variants on chromosome 1
fancy_v_count(this_sample_id = "HTMCP-01-06-00422-01A-01D",
chr_select = c("chr1"))
#> trying to find output from: battenberg
#> looking for flatfile: /projects/nhl_meta_analysis_scratch/gambl/results_local/gambl/battenberg_current/99-outputs/seg/genome--projection/HTMCP-01-06-00422-01A-01D--HTMCP-01-06-00422-10A-01D--matched.battenberg.grch37.seg
#count and plot all variants on chromosome 1
fancy_v_count(this_sample_id = "HTMCP-01-06-00422-01A-01D",
chr_select = c("chr1"))
#> trying to find output from: battenberg
#> looking for flatfile: /projects/nhl_meta_analysis_scratch/gambl/results_local/gambl/battenberg_current/99-outputs/seg/genome--projection/HTMCP-01-06-00422-01A-01D--HTMCP-01-06-00422-10A-01D--matched.battenberg.grch37.seg