n variants per chromosome plot.
fancy_v_chrcount.RdVisualizing variant (SSM or SVs) counts per chromosome.
fancy_v_chrcount(
  this_sample_id,
  maf_data,
  maf_path = NULL,
  ssm = TRUE,
  projection = "grch37",
  min_vaf = 0,
  variant_type_col = 10,
  chromosome_col = 5,
  plot_title = paste0(this_sample_id),
  y_interval = 1,
  hide_legend = FALSE,
  plot_subtitle = "Variant Count Distribution Per Chromosome",
  chr_select = paste0("chr", c(1:22)),
  coding_only = FALSE,
  from_flatfile = TRUE,
  use_augmented_maf = TRUE,
  add_qc_metric = FALSE,
  seq_type = "genome"
)
Arguments
- this_sample_id
Sample to be plotted.
- maf_data
Optional parameter with maf like df already loaded into R.
- maf_path
Optional parameter with path to external maf like file.
- ssm
Set to FALSE to get plotting data from get_combined_sv (SVs). Default value is TRUE (plots SSM retrieved from annotate_cn_by_ssm$maf)
- projection
Genome build for returned variants (only applicable for ssm = FALSE)
- min_vaf
The minimum tumour VAF for a SV to be returned. Recommended: 0 (only applicable for ssm = FALSE).
- variant_type_col
Index of column holding Variant Type (to be used with either maf_data or maf_path).
- chromosome_col
Index of column holding Chromosome (to be used with either maf_data or maf_path).
- plot_title
Title of plot (default to sample ID).
- y_interval
Optional parameter for specifying intervals on y-axis.
- hide_legend
Set to True to remove legend from plot, default is FALSE.
- plot_subtitle
Subtitle for created plot.
- chr_select
vector of chromosomes to be included in plot, defaults to autosomes.
- coding_only
Optional. Set to TRUE to restrict to plotting only coding mutations.
- from_flatfile
If set to true the function will use flat files instead of the database.
- use_augmented_maf
Boolean statement if to use augmented maf, default is FALSE.
- add_qc_metric
Boolean statement, if set to TRUE specified QC metric will be added (second y-axis).
- seq_type
Default is "genome".
Value
A plot as a ggplot object (grob).
Details
Takes a maf data frame (or path to a maf), counts the number of variants per chromosome.
Selected chromosomes (chr_select) are plotted along the x-axis and the variant counts are represented on the y-axis.
This function can plot both Structural Variants (SV) and Simple Shared Motifs (SSM).
It plots SVs per default and SSM can be added with setting ssm = TRUE.
This plot can also be restricted to only show coding mutations. To do so, set coding_only to TRUE.
In addition, the returned plot can also be superimposed with a sample-specific mean coverage (from collate_results).
To do so, set add_qc_metric to TRUE. A collection of parameters for customizing the returned plot are also available.
e.g plot_title, y_interval, hide_legend, and plot_subtitle.
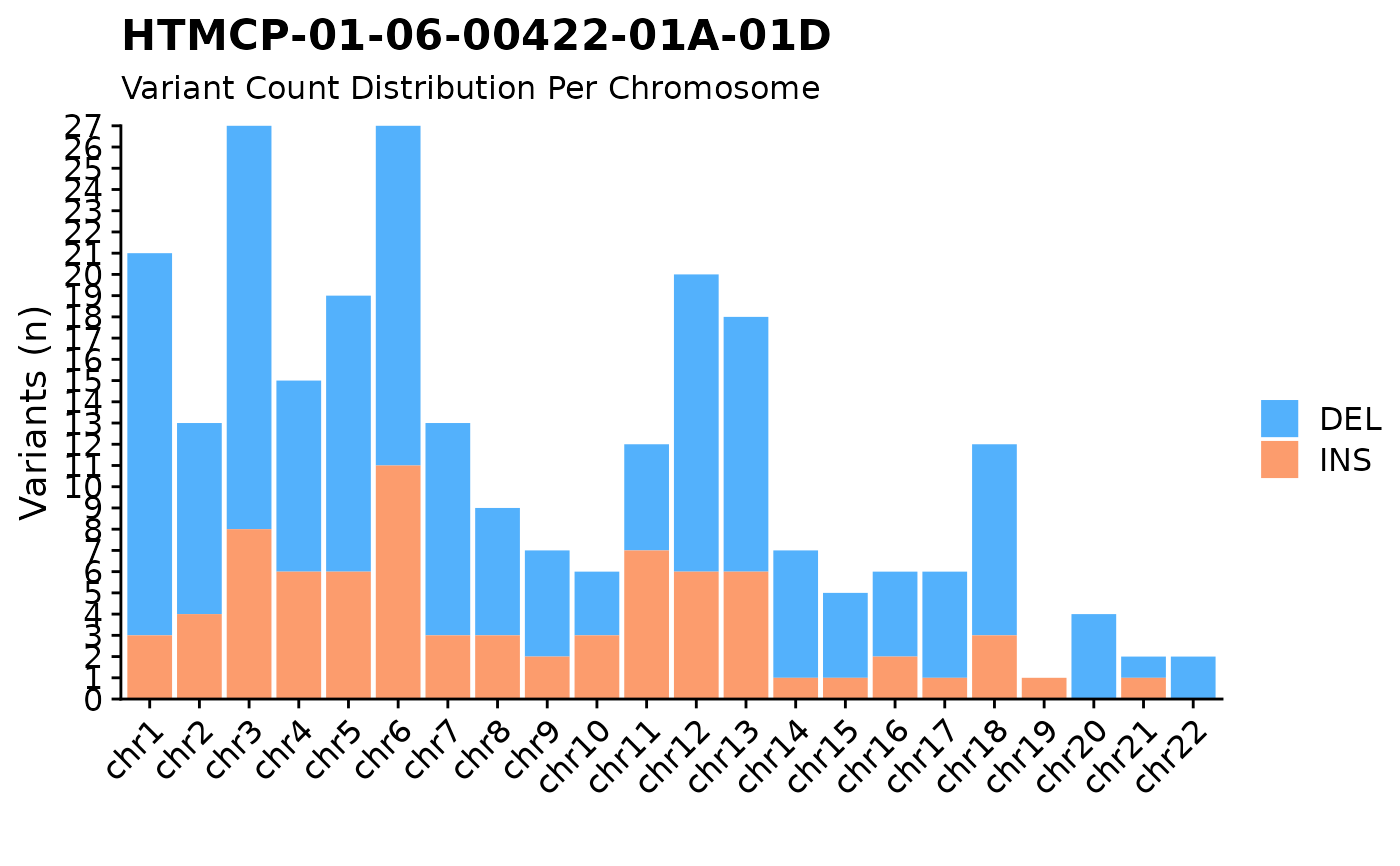
Examples
#plot ssm
fancy_v_chrcount(this_sample_id = "HTMCP-01-06-00422-01A-01D",
ssm = TRUE)
#> trying to find output from: battenberg
#> looking for flatfile: /projects/nhl_meta_analysis_scratch/gambl/results_local/gambl/battenberg_current/99-outputs/seg/genome--projection/HTMCP-01-06-00422-01A-01D--HTMCP-01-06-00422-10A-01D--matched.battenberg.grch37.seg
#> Warning: Removed 2 rows containing missing values (`position_stack()`).
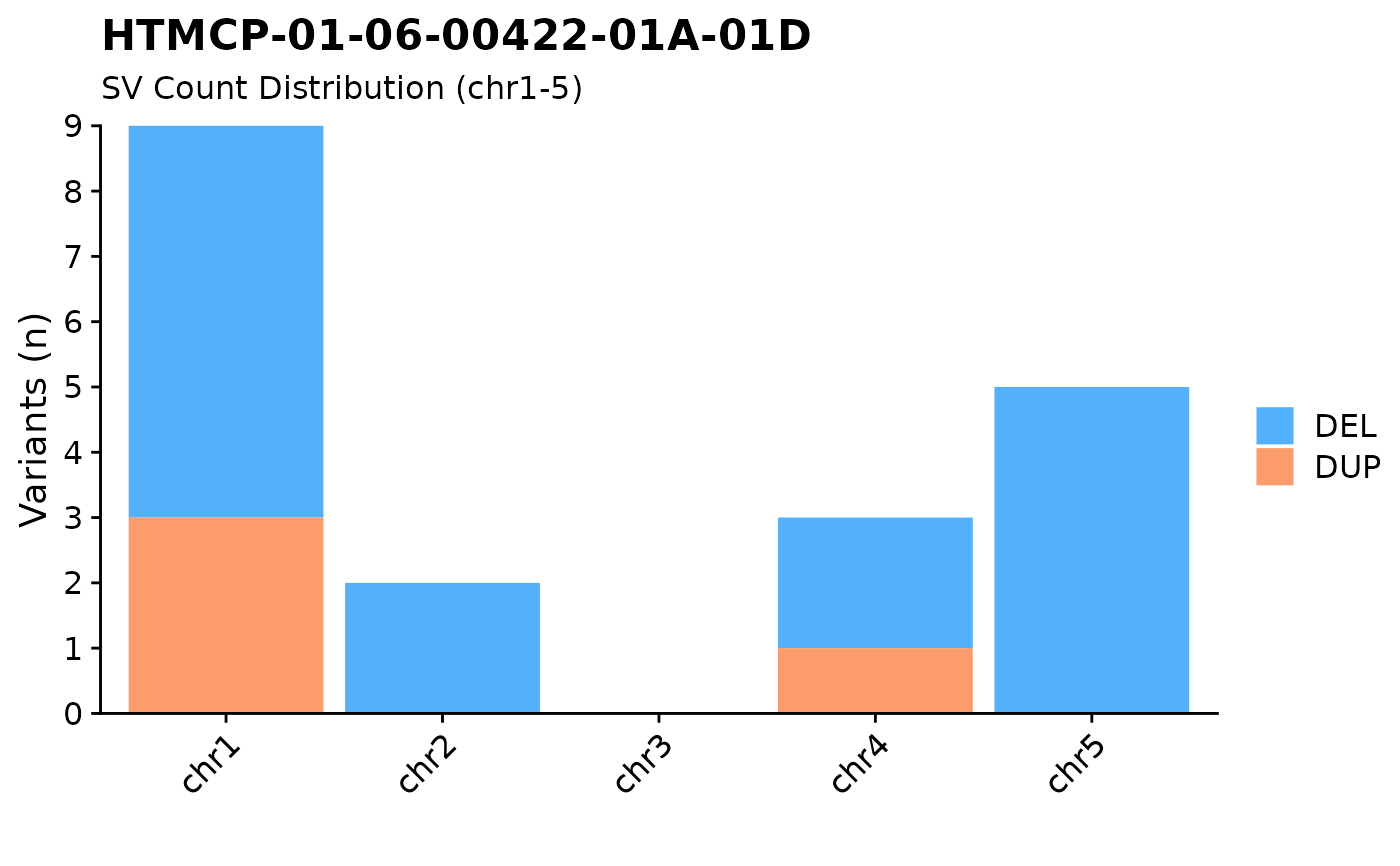
 #plot SVs for chr 1-5
fancy_v_chrcount(this_sample_id = "HTMCP-01-06-00422-01A-01D",
ssm = FALSE,
min_vaf = 0,
projection = "grch37",
chr_select = paste0("chr", c(1:5)),
plot_subtitle = "SV Count Distribution (chr1-5)")
#> Warning: number of columns of result is not a multiple of vector length (arg 3)
#> Warning: Removed 18 rows containing missing values (`position_stack()`).
#plot SVs for chr 1-5
fancy_v_chrcount(this_sample_id = "HTMCP-01-06-00422-01A-01D",
ssm = FALSE,
min_vaf = 0,
projection = "grch37",
chr_select = paste0("chr", c(1:5)),
plot_subtitle = "SV Count Distribution (chr1-5)")
#> Warning: number of columns of result is not a multiple of vector length (arg 3)
#> Warning: Removed 18 rows containing missing values (`position_stack()`).