Structural Variants Size Plot.
fancy_sv_sizedens.RdGenerate plot visualizing SV sizes. Subset on variant type, filter on VAF, size etc.
fancy_sv_sizedens(
  this_sample_id,
  maf_data,
  maf_path = NULL,
  chrom_a_col = 3,
  start_a_col = 4,
  end_a_col = 5,
  variant_type_col = 9,
  vaf_cutoff = 0,
  size_cutoff = 50,
  adjust_value = 1,
  trim = FALSE,
  hide_legend = FALSE,
  chr_select = paste0("chr", c(1:22)),
  plot_title = paste0(this_sample_id),
  plot_subtitle =
    paste0("SV sizes for Manta calls. Dashed line annotates mean variant size.\nVAF cut off: ",
    vaf_cutoff, ", SV size cut off: ", size_cutoff),
  projection = "grch37"
)
Arguments
- this_sample_id
Sample to be plotted.
- maf_data
Optional parameter with copy number df already loaded into R.
- maf_path
Optional parameter with path to external cn file.
- chrom_a_col
Index of column holding chromosome (to be used with either maf_data or maf_path).
- start_a_col
Index of column holding start coordinates (to be used with either maf_data or maf_path).
- end_a_col
Index of column holding end coordinates (to be used with either maf_data or maf_path).
- variant_type_col
Index of column holding variant type information (to be used with either maf_data or maf_path).
- vaf_cutoff
Threshold for filtering variants on VAF (events with a VAF > cutoff will be retained).
- size_cutoff
Threshold for filtering variants on size, default is 50bp.
- adjust_value
A multiplicate bandwidth adjustment. This makes it possible to adjust the bandwidth while still using the bandwidth estimator. For example, adjust = 1/2 means use half of the default bandwidth.
- trim
If FALSE, the default, each density is computed on the full range of the data.
- hide_legend
Set to True to remove legend from plot, default is FALSE.
- chr_select
Optional argument for subsetting on selected chromosomes, default is all autosomes.
- plot_title
Title of plot (default to sample ID).
- plot_subtitle
Subtitle for created plot.
- projection
Genomic projection for SVs and circos plot. Accepted values are grch37 and hg38.
Value
A plot as a ggplot object (grob).
Details
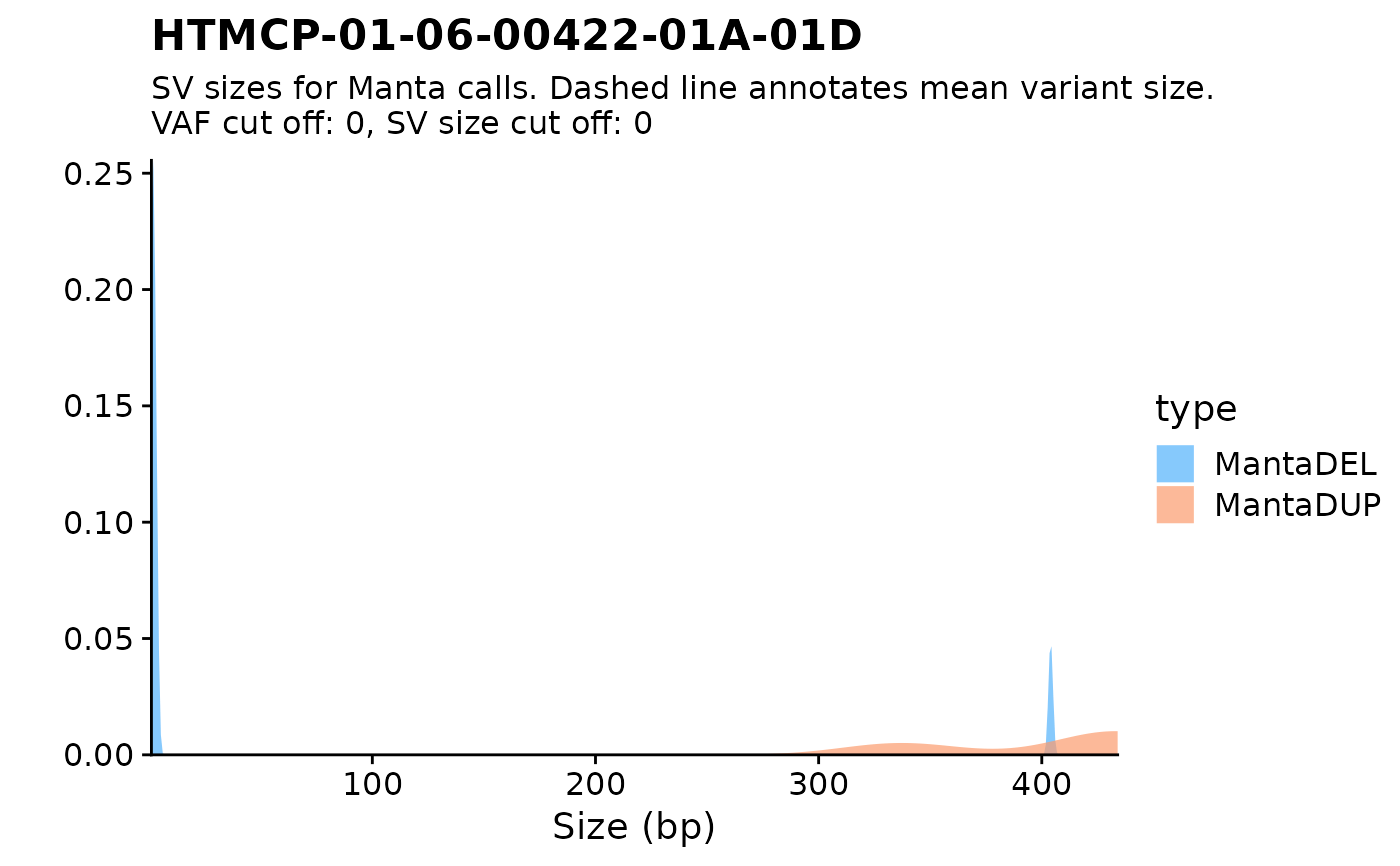
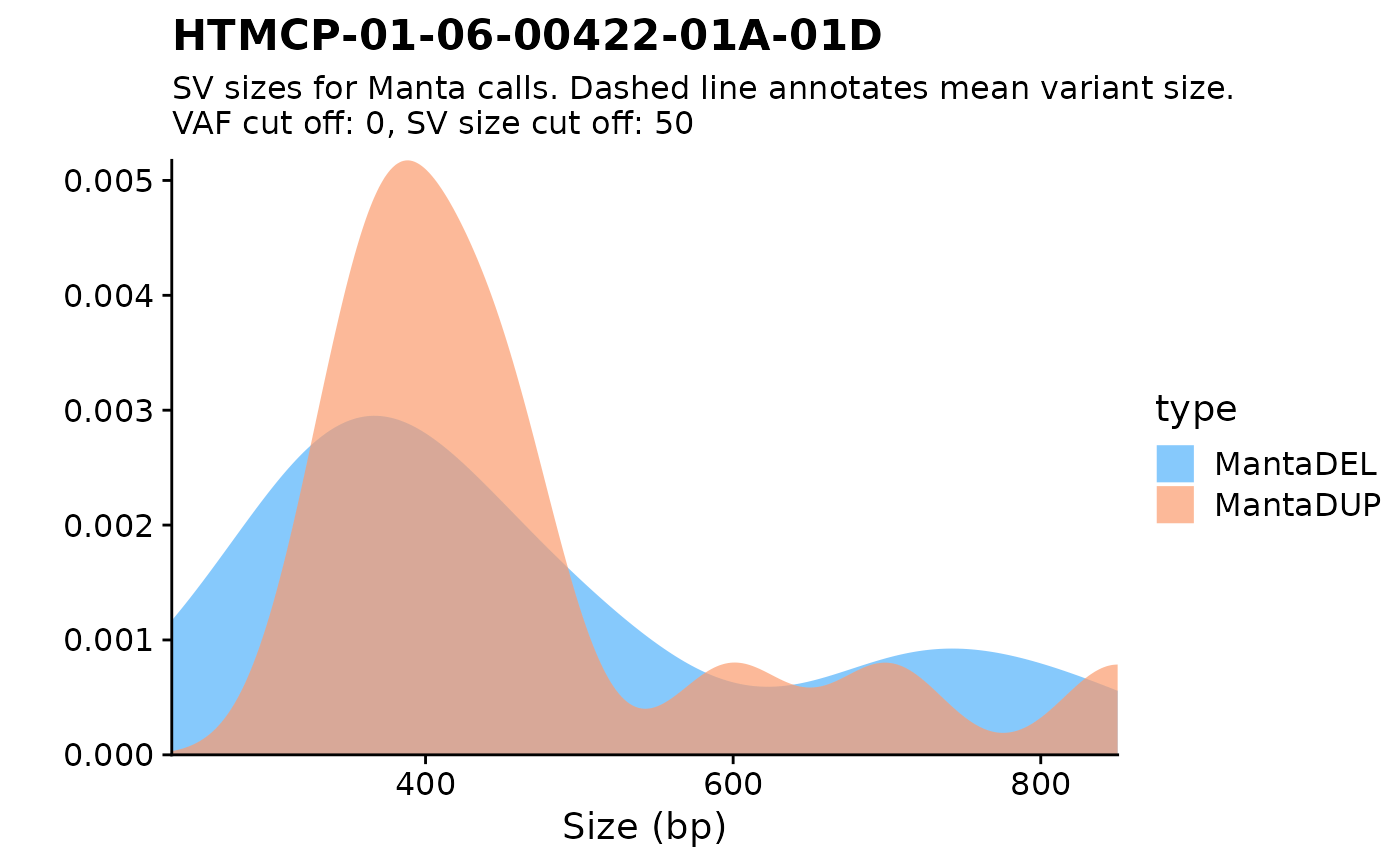
Plot sample-level SV sizes across selected chromosomes. This function also has a variety of filtering parameters available.
For example, it is possible to subset the included variants to a specific VAF threshold with VAF_cutoff. The size_cutoff is another parameter
for filtering the variants on set variant sizes, the default for this parameter is to only include variants of at least 50bp.
This function takes either a sample ID (this_sample_id) or an already loaded data frame (maf_data or a path to a maf-like file with maf_path).
If this_sample_id is called, the function will run get_combined_sv to retrieve SV calls.
If either of the maf parameters are used, note that it's possible to specify the columns of interest;
(chrom_a_col, start_a_col, end_a_col and variant_type_col), allowing this function to work with any maf-like data frames.
This function also allows the user to customize the returned plot. For more info on how to do this, please refer to the aesthetic
parameters; hide_legend, plot_title, plot_subtitle, adjust_value and trim.
Examples
#build plot sith default parameters
fancy_sv_sizedens(this_sample_id = "HTMCP-01-06-00422-01A-01D")
#> Warning: number of columns of result is not a multiple of vector length (arg 3)


#restrict plot to only chromosome 1 and 2
fancy_sv_sizedens(this_sample_id = "HTMCP-01-06-00422-01A-01D",
                  size_cutoff = 0,
                  chr_select = c("chr1", "chr2"))
#> Warning: number of columns of result is not a multiple of vector length (arg 3)
#restrict plot to only chromosome 1 and 2
fancy_sv_sizedens(this_sample_id = "HTMCP-01-06-00422-01A-01D",
size_cutoff = 0,
chr_select = c("chr1", "chr2"))
#> Warning: number of columns of result is not a multiple of vector length (arg 3)