n SNVs per chromosome plot
fancy_snv_chrdistplot.RdVisualizing the number of SNVs per chromosome.
fancy_snv_chrdistplot(
  this_sample_id,
  maf_data,
  maf_path = NULL,
  variant_type_col = 10,
  chromosome_col = 5,
  plot_title = paste0(this_sample_id),
  plot_subtitle = "SNV Distribution Per Chromosome",
  chr_select = paste0("chr", c(1:22)),
  include_dnp = FALSE,
  hide_legend = FALSE,
  coding_only = FALSE,
  from_flatfile = TRUE,
  use_augmented_maf = TRUE,
  this_seq_type = "genome"
)
Arguments
- this_sample_id
Sample to be plotted.
- maf_data
Optional parameter with maf like df already loaded into R.
- maf_path
Optional parameter with path to external maf like file.
- variant_type_col
Index of column holding Variant Type (to be used with either maf_data or maf_path).
- chromosome_col
Index of column holding Chromosome (to be used with either maf_data or maf_path).
- plot_title
Title of plot (default to sample ID).
- plot_subtitle
Subtitle for created plot.
- chr_select
vector of chromosomes to be included in plot, defaults to autosomes.
- include_dnp
Optional argument for including DNPs. Default is FALSE.
- hide_legend
Set to True to remove legend from plot, default is FALSE.
- coding_only
Optional. Set to TRUE to restrict to plotting only coding mutations.
- from_flatfile
If set to true the function will use flat files instead of the database.
- use_augmented_maf
Boolean statement if to use augmented maf, default is FALSE.
- this_seq_type
Seq type for returned CN segments. One of "genome" (default) or "capture".
Value
A plot as a ggplot object (grob).
Details
This function takes on an already loaded maf-like data frame, or a path to the maf file of interest.
In addition, the user can also give this function a sample ID and the function will run assign_cn_to_ssm
to get data for plotting. If a maf file or data frame is used, the user has the chance to specify what column
that holds the Variant Type information (variant_type_col), in addition the user can also specify what column
in the incoming maf that is corresponding to the chromosome annotations. This function also includes useful subsetting
options. For example, chr_select allows the user to restrict the plot to specific chromosomes. include_dnp is an optional
argument (Boolean) for if variants of this subtype should be included or not. The plot can also be restricted to only
counting coding mutations (coding_only). Flat-file and augmented maf options can be toggled with from_flatfile
and use_augmented_maf. Both are TRUE by default and should rarely be set to FALSE. Lastly, this plotting function
also have convenient parameters for customizing the returned plot, e.g plot_title, y_interval, hide_legend, andplot_subtitle.
Examples
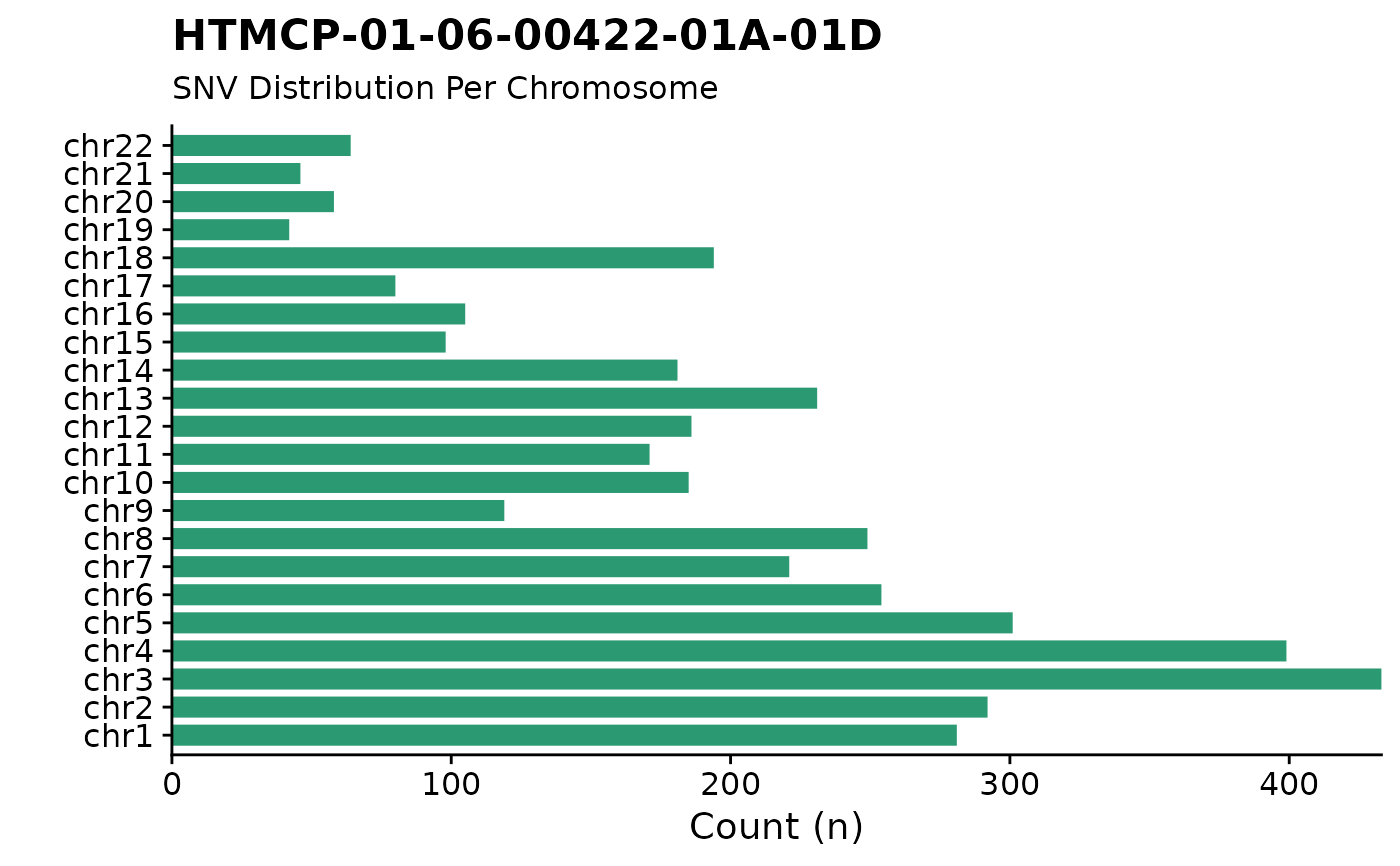
#plot SNVs
fancy_snv_chrdistplot(this_sample_id = "HTMCP-01-06-00422-01A-01D")
#> trying to find output from: battenberg
#> looking for flatfile: /projects/nhl_meta_analysis_scratch/gambl/results_local/gambl/battenberg_current/99-outputs/seg/genome--projection/HTMCP-01-06-00422-01A-01D--HTMCP-01-06-00422-10A-01D--matched.battenberg.grch37.seg
#> Warning: Removed 1 rows containing missing values (`position_stack()`).
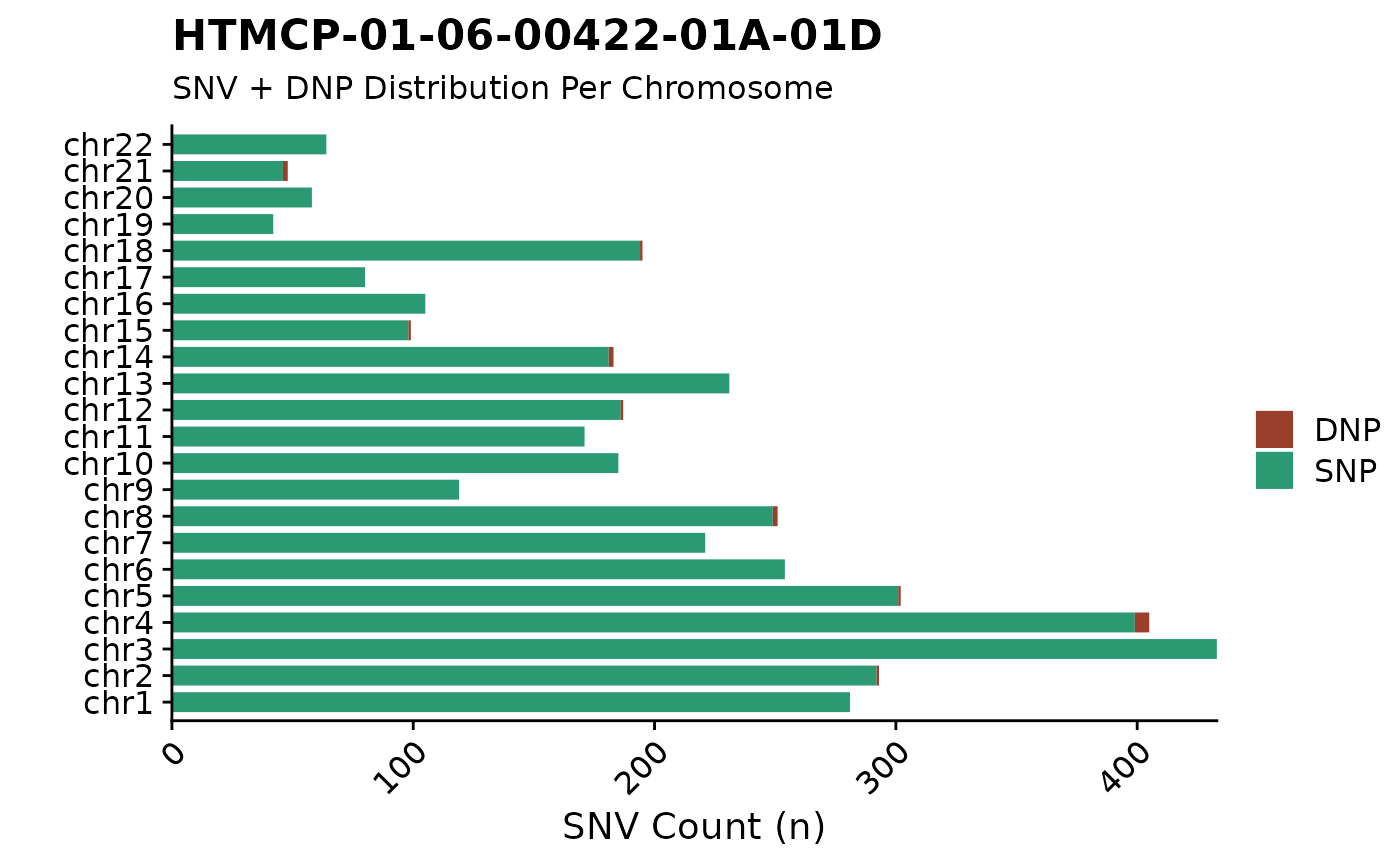
 #plot SNVs and DNPs
fancy_snv_chrdistplot(this_sample_id = "HTMCP-01-06-00422-01A-01D",
include_dnp = TRUE,
plot_subtitle = "SNV + DNP Distribution Per Chromosome")
#> trying to find output from: battenberg
#> looking for flatfile: /projects/nhl_meta_analysis_scratch/gambl/results_local/gambl/battenberg_current/99-outputs/seg/genome--projection/HTMCP-01-06-00422-01A-01D--HTMCP-01-06-00422-10A-01D--matched.battenberg.grch37.seg
#> Warning: Removed 2 rows containing missing values (`position_stack()`).
#plot SNVs and DNPs
fancy_snv_chrdistplot(this_sample_id = "HTMCP-01-06-00422-01A-01D",
include_dnp = TRUE,
plot_subtitle = "SNV + DNP Distribution Per Chromosome")
#> trying to find output from: battenberg
#> looking for flatfile: /projects/nhl_meta_analysis_scratch/gambl/results_local/gambl/battenberg_current/99-outputs/seg/genome--projection/HTMCP-01-06-00422-01A-01D--HTMCP-01-06-00422-10A-01D--matched.battenberg.grch37.seg
#> Warning: Removed 2 rows containing missing values (`position_stack()`).