genome-wide ideogram annotated with SSM and CN information
fancy_ideogram.RdGenerate sample-level ideogram with copy number information, ssm and gene annotations, etc.
fancy_ideogram(
  this_sample_id,
  gene_annotation,
  seq_data,
  seq_path = NULL,
  maf_data,
  maf_path = NULL,
  variant_type_col_maf = 10,
  chromosome_col_maf = 5,
  start_col_maf = 6,
  end_col_maf = 7,
  chrom_col_seq = 2,
  start_col_seq = 3,
  end_col_seq = 4,
  cn_col_seq = 7,
  plot_title = paste0(this_sample_id),
  plot_subtitle = "Genome-wide Ideogram (grch37).",
  intersect_regions,
  include_ssm = TRUE,
  ssm_count = TRUE,
  coding_only = FALSE,
  from_flatfile = TRUE,
  use_augmented_maf = TRUE,
  this_seq_type = "genome"
)
Arguments
- this_sample_id
Sample to be plotted (for multiple samples, see fancy_multisample_ideogram.
- gene_annotation
Annotate ideogram with a set of genes. These genes can either be specified as a vector of characters or a data frame.
- seq_data
Optional parameter with copy number df already loaded into R.
- seq_path
Optional parameter with path to external cn file.
- maf_data
Optional parameter with maf like df already loaded into R.
- maf_path
Optional parameter with path to external maf like file.
- variant_type_col_maf
Index of column holding Variant Type (to be used with either maf_data or maf_path).
- chromosome_col_maf
Index of column holding Chromosome (to be used with either maf_data or maf_path).
- start_col_maf
Index of column with variant start coordinates (to be used with either maf_data or maf_path).
- end_col_maf
Index of column with variant end coordinates (to be used with either maf_data or maf_path).
- chrom_col_seq
Index of column with chromosome annotations (to be used with either maf_data or maf_path).
- start_col_seq
Index of column with copy number start coordinates (to be used with either maf_data or maf_path).
- end_col_seq
Index of column with copy number end coordinates (to be used with either maf_data or maf_path).
- cn_col_seq
Index of column holding copy number information (to be used with either maf_data or maf_path).
- plot_title
Title of plot (default to sample ID).
- plot_subtitle
Optional argument for plot subtitle.
- intersect_regions
Optional parameter for subset variant calls to specific regions. Should be either a vector of characters (chr:start-end) or data frame with regions.
- include_ssm
Set to TRUE to plot SSMs (dels and ins).
- ssm_count
Optional parameter to summarize n variants per chromosome, inlcude_ssm must be set to TRUE.
- coding_only
Optional. Set to TRUE to restrict to plotting only coding mutations.
- from_flatfile
If set to true the function will use flat files instead of the database.
- use_augmented_maf
Boolean statement if to use augmented maf, default is FALSE.
- this_seq_type
Seq type for returned CN segments. One of "genome" (default) or "capture".
Value
A plot as a ggplot object (grob).
Details
This function generates genome-wide ideograms, visualizing SSM data as well as CN segments.
It is also possible to superimpose the plot with gene annotations. Offering a comprehensive overview of all SSM and CN segments of different aneuploidy.
The plotting of SSM can be toggled with setting include_ssm to TRUE. If so, it is also possible to count the number of SSMs per chromosome with ssm_count = TRUE.
To get data for plotting, there are a few different options available; like all fanncy_x_plots a sample ID can be provided to the this_sample
parameter. If done so, the function will retrieve data (SSm and CN segments) by wrapping the appropriate functions.
This data can also be provided with seq_data, seg_path, maf_data and maf_path.
For more info on how to run with these parameters, refer to the parameter descriptions.
In order to annotate the ideogram with genes, simply give the gene_annotations parameter a set of genes as a vector of characters or a data frame with gene names in the first column.
Another useful parameter for restricting the plotted regions is to call the function with intersect_regions.
This parameter takes a vector of characters or a data frame with regions that the plotted calls are restricted to.
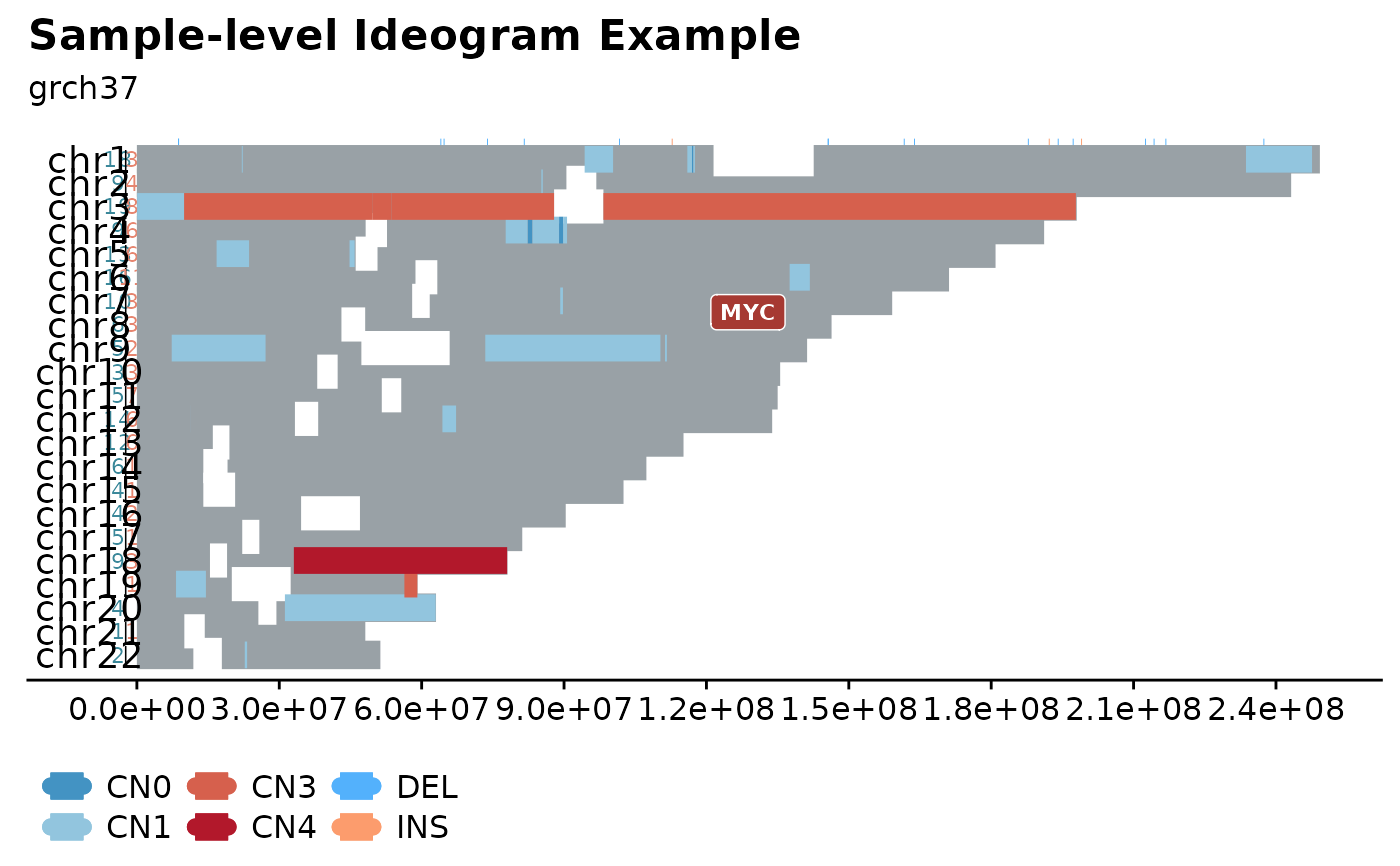
Examples
#build plot
fancy_ideogram(this_sample_id = "HTMCP-01-06-00422-01A-01D",
               gene_annotation = "MYC",
               plot_title = "Sample-level Ideogram Example",
               plot_subtitle = "grch37")
#> 1 region(s) returned for 1 gene(s)
#> Warning: NAs introduced by coercion
#> Warning: invalid factor level, NA generated
#> Warning: ‘>’ not meaningful for factors
#> trying to find output from: battenberg
#> looking for flatfile: /projects/nhl_meta_analysis_scratch/gambl/results_local/gambl/battenberg_current/99-outputs/seg/genome--projection/HTMCP-01-06-00422-01A-01D--HTMCP-01-06-00422-10A-01D--matched.battenberg.grch37.seg
#> Warning: NAs introduced by coercion
#> Warning: NAs introduced by coercion
#> Warning: Ignoring unknown aesthetics: label
#> Warning: Ignoring unknown parameters: `check_overlap`
#> Warning: Width not defined
#> ℹ Set with `position_dodge(width = ...)`
#> Warning: Width not defined
#> ℹ Set with `position_dodge(width = ...)`
#> Warning: Width not defined
#> ℹ Set with `position_dodge(width = ...)`
#> Warning: Width not defined
#> ℹ Set with `position_dodge(width = ...)`
#> Warning: Width not defined
#> ℹ Set with `position_dodge(width = ...)`
#> Warning: Width not defined
#> ℹ Set with `position_dodge(width = ...)`
#> Warning: Width not defined
#> ℹ Set with `position_dodge(width = ...)`
#> Warning: Width not defined
#> ℹ Set with `position_dodge(width = ...)`
#> Warning: Width not defined
#> ℹ Set with `position_dodge(width = ...)`
#> Warning: Width not defined
#> ℹ Set with `position_dodge(width = ...)`
#> Warning: Width not defined
#> ℹ Set with `position_dodge(width = ...)`
#> Warning: Width not defined
#> ℹ Set with `position_dodge(width = ...)`
#> Warning: Width not defined
#> ℹ Set with `position_dodge(width = ...)`
#> Warning: Removed 8 rows containing missing values (`geom_segment()`).
#> Warning: Removed 8 rows containing missing values (`geom_segment()`).
#> Warning: Removed 8 rows containing missing values (`geom_segment()`).
#> Warning: Removed 4 rows containing missing values (`geom_segment()`).
#> Warning: Removed 4 rows containing missing values (`geom_segment()`).
#> Warning: Removed 4 rows containing missing values (`geom_segment()`).
#> Warning: Removed 1 rows containing missing values (`geom_text()`).
#> Warning: Removed 1 rows containing missing values (`geom_text()`).
#> Warning: Removed 6 rows containing missing values (`geom_segment()`).