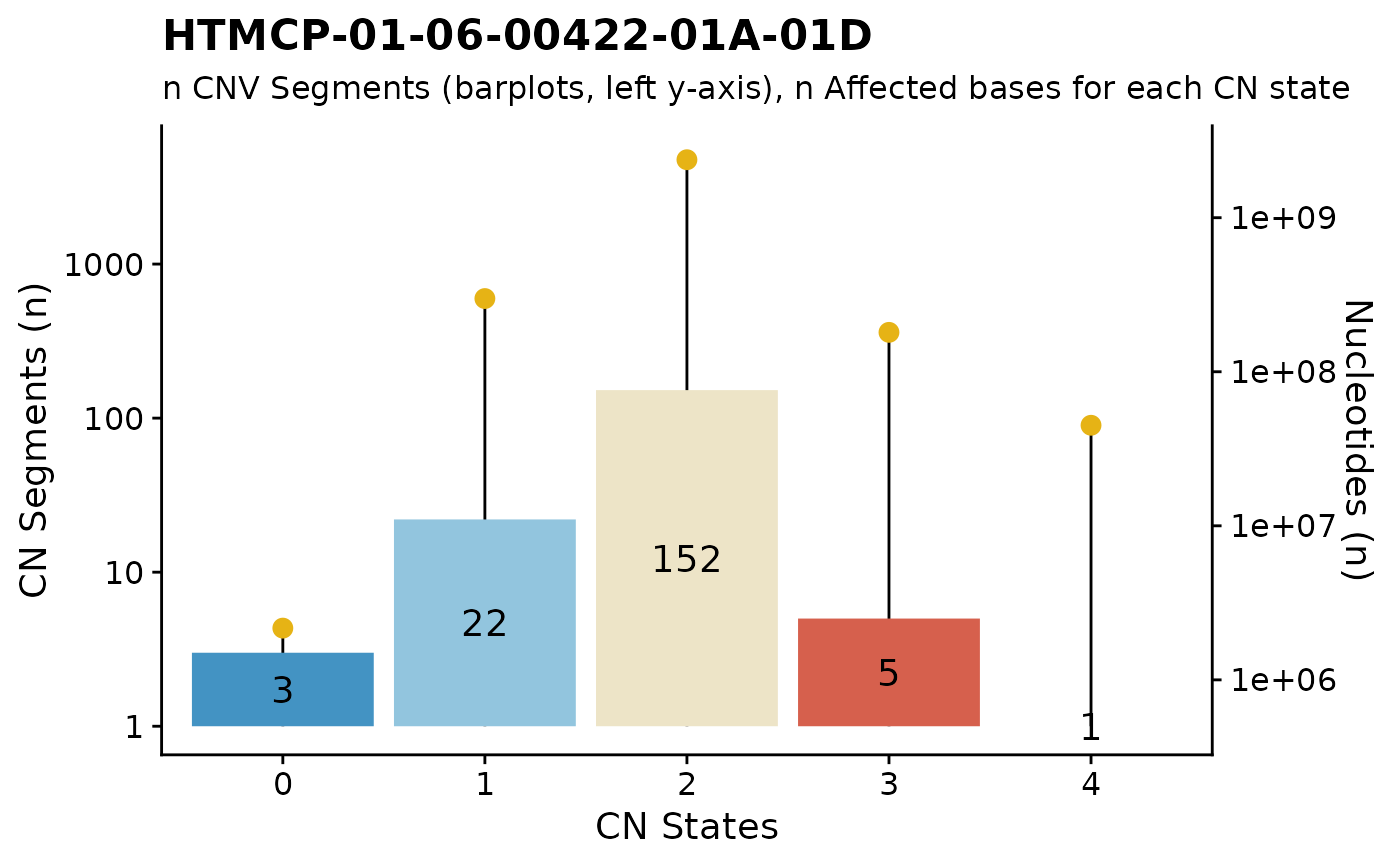
Copy Number states barplot
fancy_cnbar.RdGenerate a bar plot visualizing sample-specific copy number states and affected bases for each CN segment.
fancy_cnbar(
  this_sample_id,
  seq_data,
  seq_path = NULL,
  chrom_col = 2,
  start_col = 3,
  end_col = 4,
  cn_col = 7,
  plot_title = paste0(this_sample_id),
  plot_subtitle =
    "n CNV Segments (barplots, left y-axis), n Affected bases for each CN state",
  chr_select = paste0("chr", c(1:22)),
  cutoff = 15,
  include_cn2 = TRUE,
  this_seq_type = "genome"
)
Arguments
- this_sample_id
Sample to be plotted.
- seq_data
Optional parameter with copy number df already loaded into R.
- seq_path
Optional parameter with path to external cn file.
- chrom_col
Index of column with chromosome annotations (to be used with either maf_data or maf_path).
- start_col
Index of column with copy number start coordinates (to be used with either maf_data or maf_path).
- end_col
Index of column with copy number end coordinates (to be used with either maf_data or maf_path).
- cn_col
Index of column holding copy number information (to be used with either maf_data or maf_path).
- plot_title
Title of plot (default to sample ID).
- plot_subtitle
Subtitle for created plot.
- chr_select
Vector of chromosomes to be included in plot, defaults to autosomes.
- cutoff
Set threshold for maximum CN state to be retrieved.
- include_cn2
Optional boolean statement for including CN = 2 states in plot.
- this_seq_type
Seq type for returned CN segments. One of "genome" (default) or "capture".
Value
A plot as a ggplot object (grob).
Details
fancy_cnbar visualizes copy number (CN) states on sample-level. Similarly to other fancy_x_plots this function
accepts either a sample ID, for which the function will get copy number states with get_sample_cn_segments. The function
can also accept an already loaded seq file given to the seq_data parameter. It can also load a seq file with the seq_path
parameter. If the user calls either seq_data or seq_path, there are a collection of parameters available for specifying
the relevant columns in the given data frame (chrom_col, starat_col, end_col, cn_col). It is also possible to
restrict the returned plot to any given chromosome. This is done with the chr_select parameter (default is all autosomes).
For further control of the returned plot, it is also possible to set the threshold for maximum CN states to be returned (default is 15).
With include_cn2 (Boolean) the user can control if CN segments = 2 should be added to the plot, default is TRUE.
The user can also control the annotations of the returned plot with plot_title and plot_subtitle. Lastly,
This function also computes the number of affected bases for each copy number state and plots these values on a secondary y-axis (right),
useful for overviewing the extent of each copy number state, in the context of the full genome.
Examples
#Return a plot for one sample, with default parameters.
fancy_cnbar(this_sample_id = "HTMCP-01-06-00422-01A-01D")
#> Warning: Ignoring unknown aesthetics: label