Pretty Lollipop Plot.
pretty_lollipop_plot.RdGenerates a visually appealing lollipop plot.
Usage
pretty_lollipop_plot(
  maf_df,
  gene = NULL,
  plot_title,
  by_allele = TRUE,
  max_count = 10,
  include_silent = FALSE,
  labelPos = NULL,
  show_rate = FALSE,
  title_size = 8,
  x_axis_size = 4,
  domain_label_size = 0,
  aa_label_size = 3
)
Arguments
- maf_df
A data frame containing the mutation data.
- gene
The gene symbol to plot.
- plot_title
Optional, the title of the plot. Default is gene.
- by_allele
Set to FALSE to consider all mutations at the same codon as equivalent. When FALSE, and combined with labelPos, the labels will only indicate the amino acid number. Default is TRUE.
- include_silent
Logical parameter indicating whether to include silent mutations into coding mutations. Default is FALSE.
- labelPos
Specify which AA positions to label in the plot (default is no labels).
Details
Retrieve maf data of a specific sample or a set of samples. A gene of interest can then be visualized with the given maf data. Silent mutations can be visualized setting include_silent to TRUE.
Examples
library(GAMBLR.open)
suppressMessages(
suppressWarnings({
#get meta data (BL_Thomas)
metadata <- suppressMessages(get_gambl_metadata()) %>%
filter(seq_type == "genome") %>%
check_and_clean_metadata(.,duplicate_action="keep_first")
maf_df <- get_coding_ssm(
these_samples_metadata = metadata
)
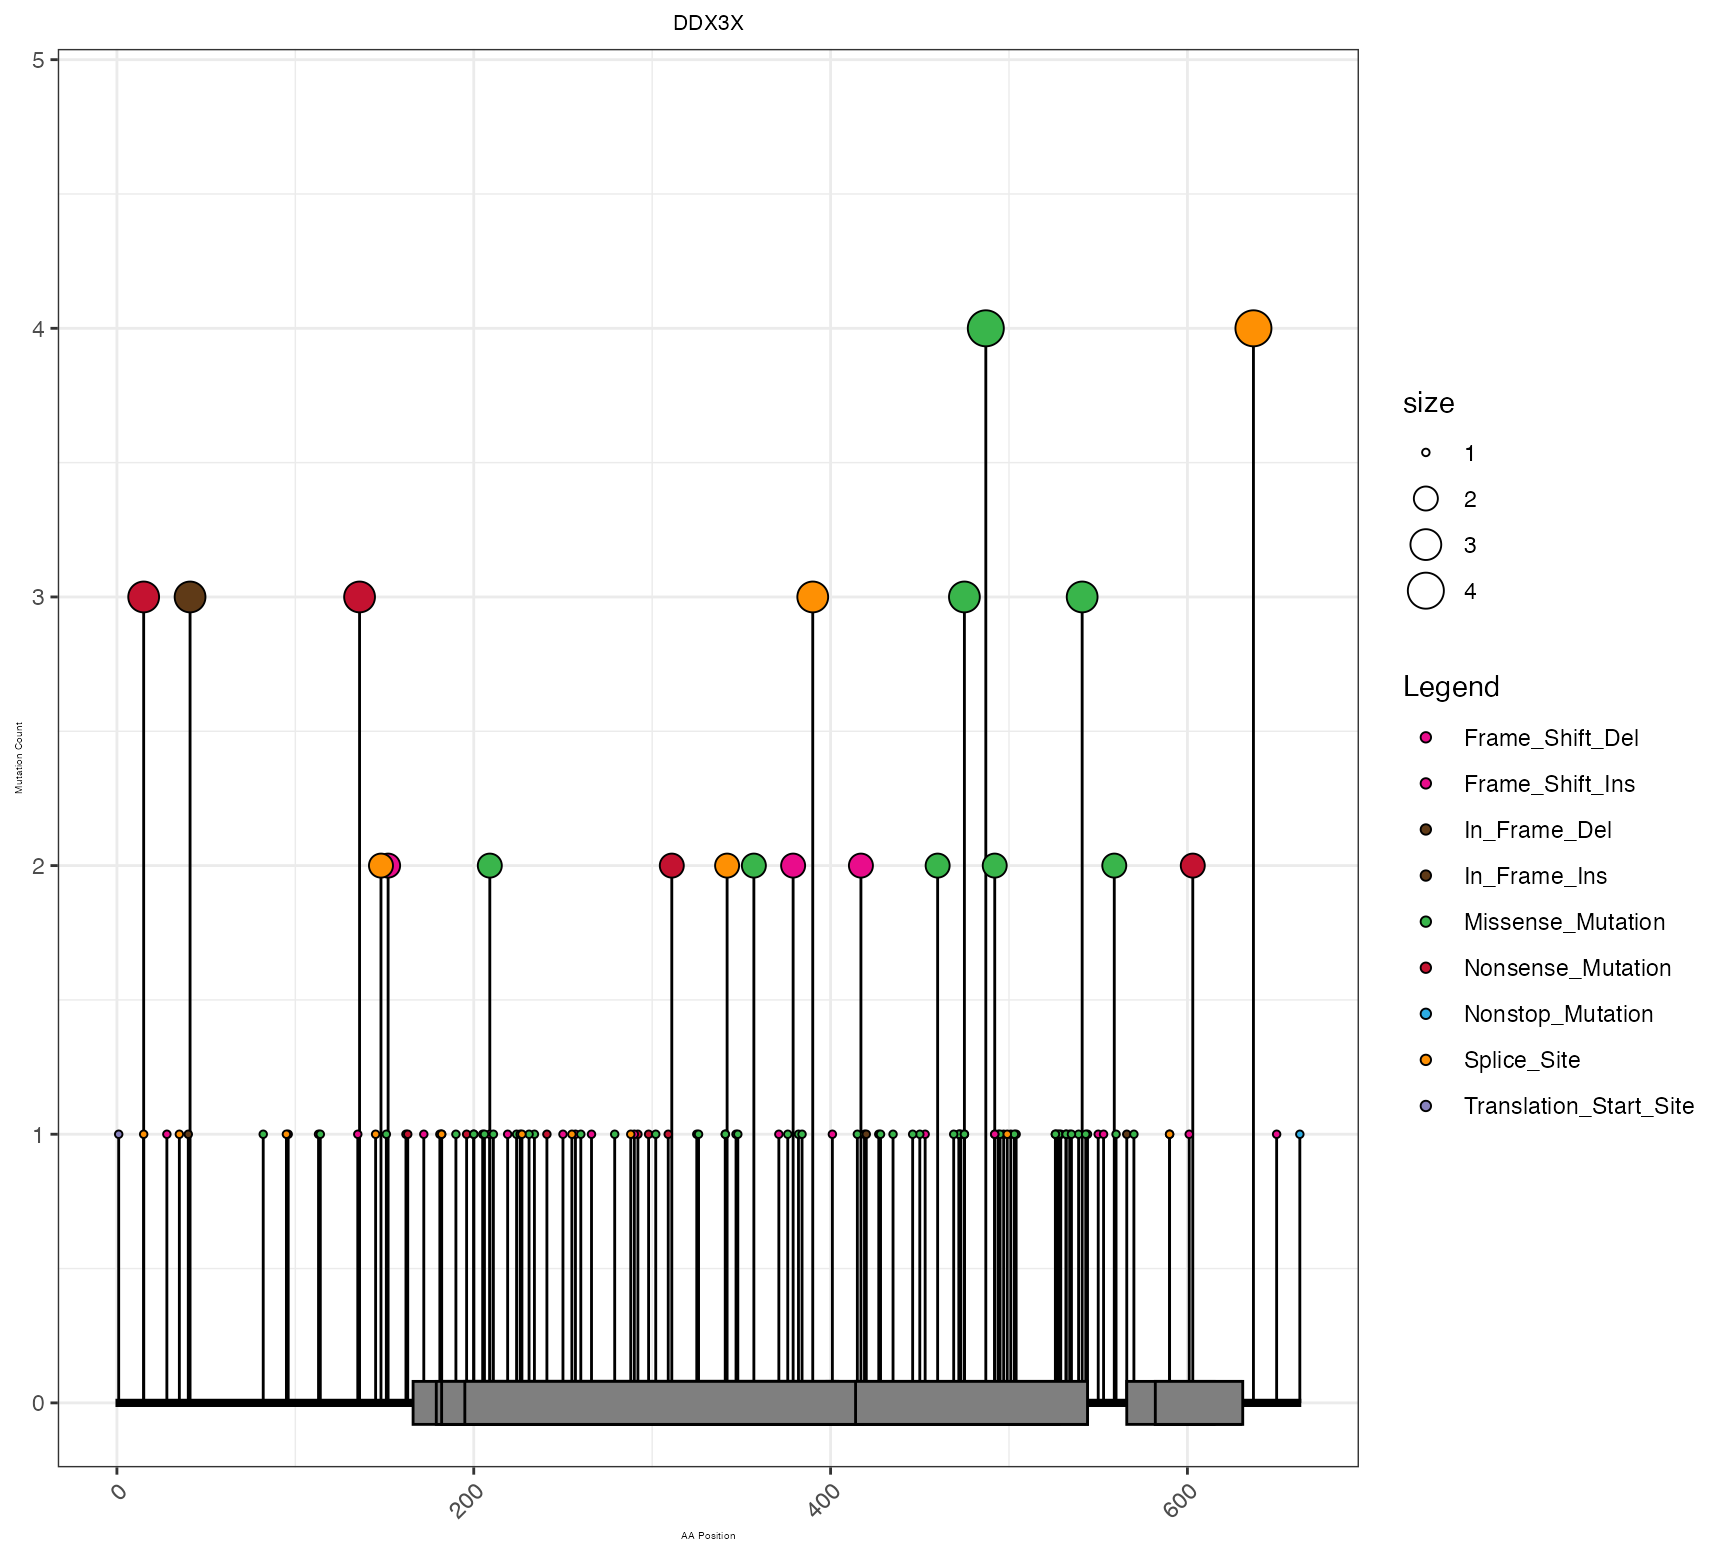
#construct pretty_lollipop_plot.
lollipop_result <- pretty_lollipop_plot(maf_df, "DDX3X")
print(lollipop_result)
}))