pretty_circular_mutation_frequency_heatmap
pretty_circular_mutation_frequency_heatmap.Rdpretty_circular_mutation_frequency_heatmap
Usage
pretty_circular_mutation_frequency_heatmap(
  prettyOncoplot_output,
  cn_status_matrix,
  collated_results,
  these_samples_metadata,
  genes,
  cluster = T,
  keep_these_pathologies,
  min_sample_num = 20,
  col_fun,
  col_theme,
  return_data = FALSE,
  dend_location = "inside",
  clustering_distance_method = "euclidean",
  border = T,
  split_by_type = FALSE,
  rotate_degrees = 0,
  gap.degree = 15,
  show.sector.labels = FALSE,
  label_cex = 0.5,
  rownames_cex = 0.5,
  include_legend = F,
  colour_labels = F,
  label_group = "text",
  label_alpha
)
Arguments
- prettyOncoplot_output
The output of the prettyOncoplot function
- cn_status_matrix
The output of get_cn_states
- collated_results
A list of data frames with sample_id as rownames and features as column names
- these_samples_metadata
A data frame with metadata. Usually the output of [GAMBLR.results::get_gambl_metadata].
- genes
A vector of genes to label
- cluster
Whether to perform clustering. Default is TRUE (clustering is performed).
- keep_these_pathologies
A vector of pathology values to show in the plot. All the remaining rows will be ignored.
- min_sample_num
Minimum number of samples in a pathology to be considered for the plot. Pathologies with less than this number will be excluded. (20)
- col_fun
Color function to modify the default color pallette of the heatmap.
- col_theme
Alternatively, provide the color theme instead of `col_fun` to change the default colors of the heatmap.
- return_data
Conditionally return the formatted data used for the plotting. Default is FALSE (only image is plotted and no data is returned).
- dend_location
Location of the dendrogram. Default is "inside".
- clustering_distance_method
Clustering method. Default is "euclidean".
- border
Whether to draw border around heatmap. Default is TRUE (with border).
- split_by_type
Whether to split the mutations by type. Default is FALSE (no splitting).
- rotate_degrees
Rotate labels. Default is 0 (no rotation).
- gap.degree
Gap degree. Default is 15.
- show.sector.labels
Show labels for each sector of the heatmap. Default is FALSE (no labels).
- label_cex
Number indicating the amount by which plotting text and symbols should be scaled relative to the default when displaying the labels. Default is 0.5.
- rownames_cex
Number indicating the amount by which plotting text and symbols should be scaled relative to the default when displaying the rownames. Default is 0.5.
- include_legend
Whether to include the legend. Default is FALSE (no legend).
- colour_labels
Optionally color labels. Default is FALSE (no coloring).
- label_group
How to group the labels. Default is "text".
- label_alpha
Value from 0 to 1 to control alpha of the label.
Examples
library(dplyr)
library(GAMBLR.open)
suppressMessages(
suppressWarnings({
metadata <- get_gambl_metadata() %>%
dplyr::filter(!seq_type == "mrna") %>%
dplyr::filter(pathology %in% names(get_gambl_colours("pathology"))) %>%
check_and_clean_metadata(.,duplicate_action="keep_first")
all_coding <- get_coding_ssm(these_samples_metadata = metadata)
genes <- lymphoma_genes %>%
dplyr::filter(DLBCL|FL|BL) %>%
dplyr::pull(Gene) %>%
unique %>%
sort
oncoplot_output <- prettyOncoplot(
all_coding,
genes = genes,
minMutationPercent = 2,
these_samples_metadata = metadata,
simplify_annotation = TRUE,
return_inputs = TRUE
)
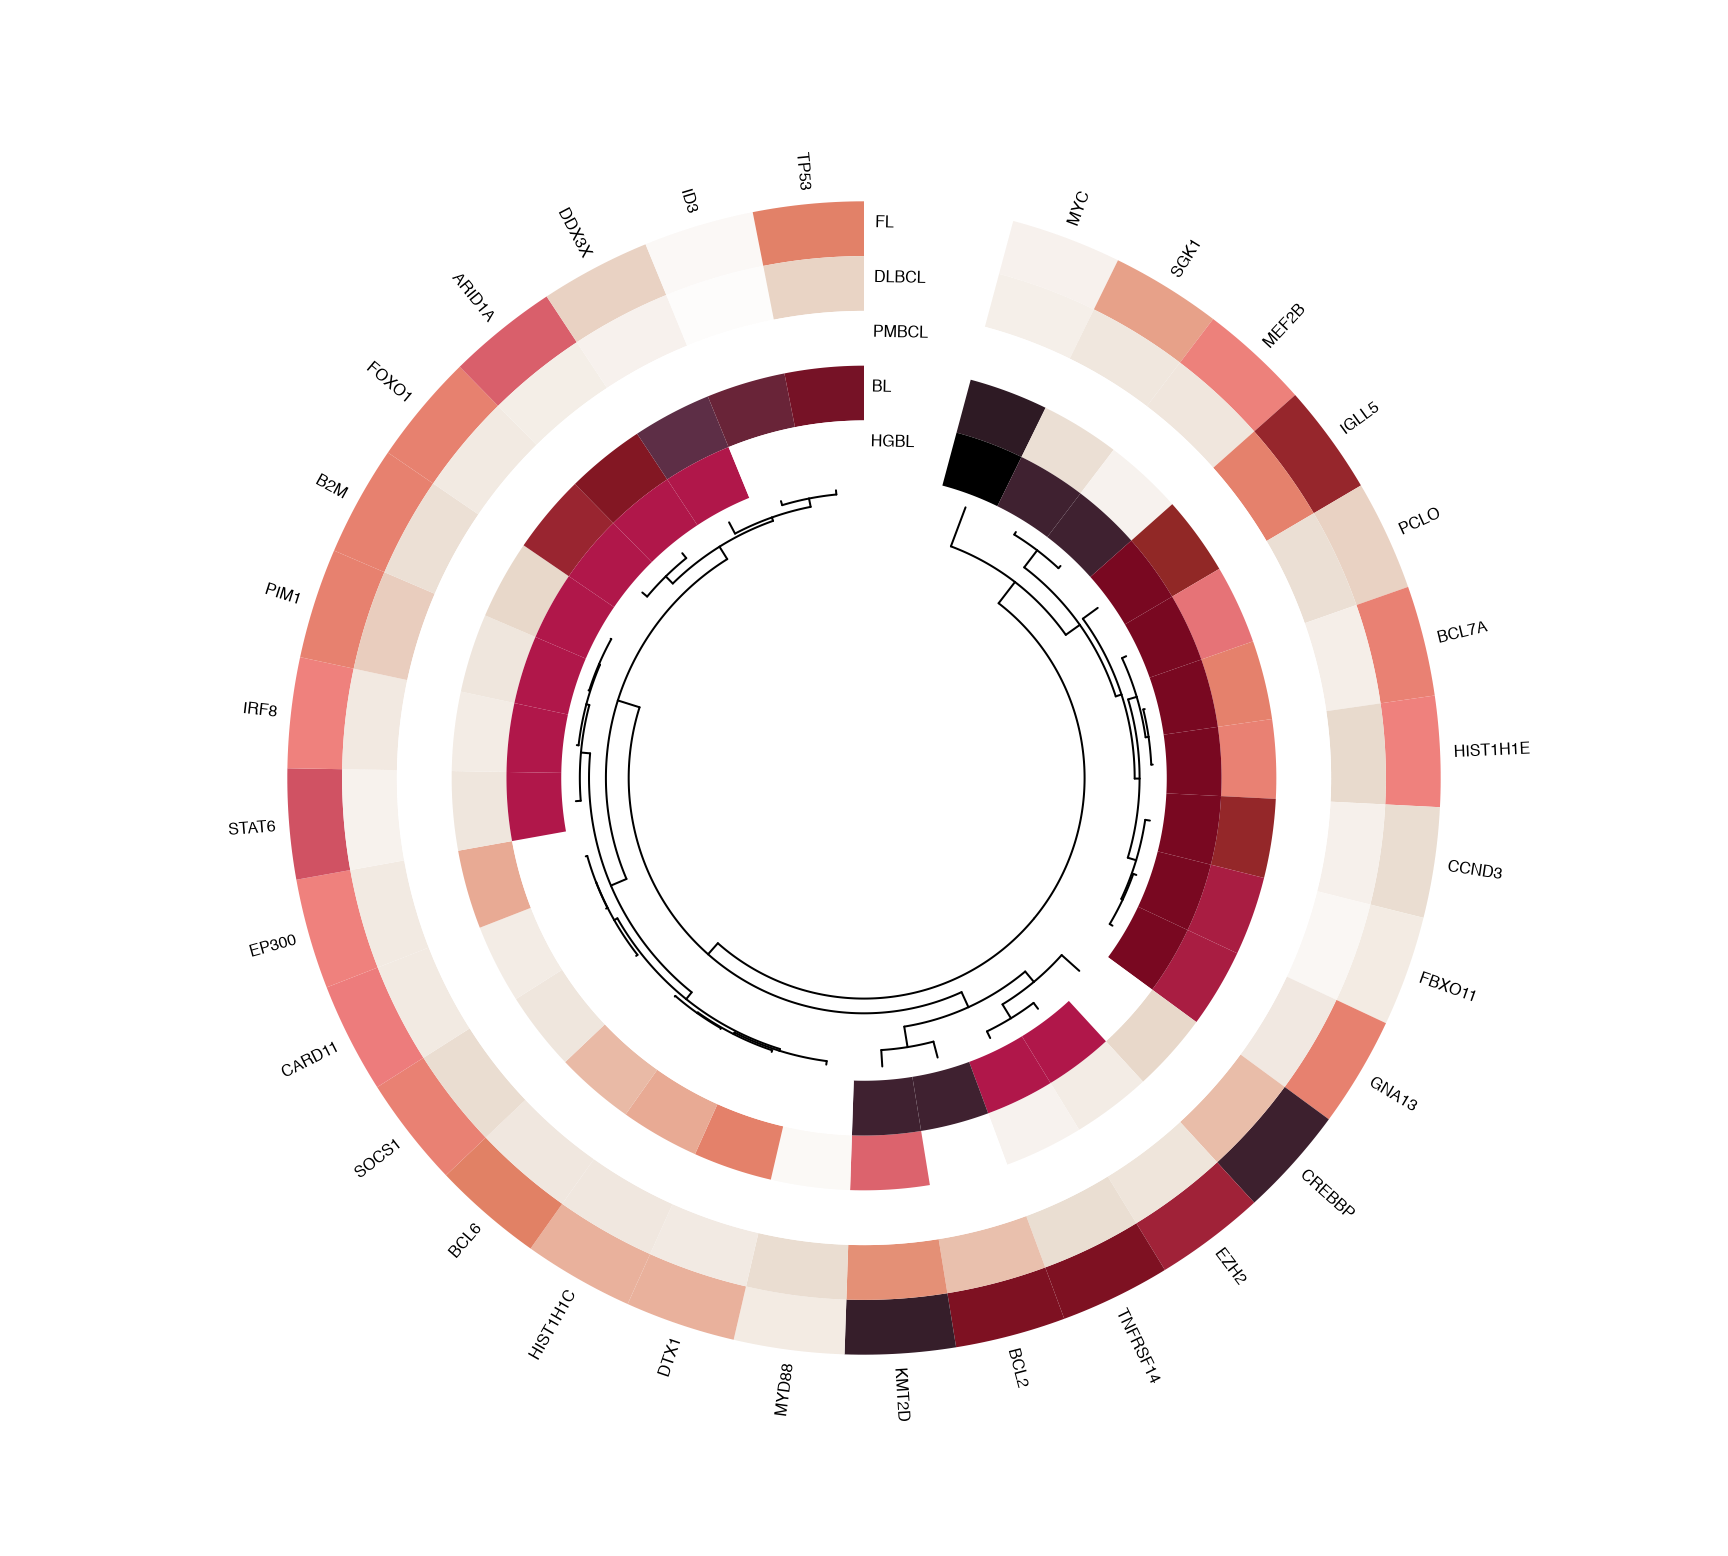
# Basic plot
pretty_circular_mutation_frequency_heatmap(
prettyOncoplot_output = oncoplot_output,
keep_these_pathologies = c(
"FL", "DLBCL", "PMBCL", "BL", "HGBL"
)
)
}))
 suppressMessages(
suppressWarnings({
# Add sv layer
all_sv <- get_manta_sv(these_samples_metadata = metadata)
annotated_sv <- annotate_sv(all_sv) %>%
dplyr::filter(gene %in% genes, !is.na(partner)) %>%
dplyr::select(sample_id = tumour_sample_id, gene)
# This is to replicate the output format of collate_sv
sv_collated <- annotated_sv %>%
dplyr::mutate(
gene = paste("manta", gene, "sv", sep = "_"),
mutated = "POS"
) %>%
dplyr::distinct() %>%
tidyr::pivot_wider(
names_from = gene,
values_from = mutated
) %>%
replace(is.na(.), "NEG")
# Plot SSM + SVs
pretty_circular_mutation_frequency_heatmap(
collated_results = list(sv_collated),
prettyOncoplot_output = oncoplot_output,
these_samples_metadata = metadata
)
}))
suppressMessages(
suppressWarnings({
# Add sv layer
all_sv <- get_manta_sv(these_samples_metadata = metadata)
annotated_sv <- annotate_sv(all_sv) %>%
dplyr::filter(gene %in% genes, !is.na(partner)) %>%
dplyr::select(sample_id = tumour_sample_id, gene)
# This is to replicate the output format of collate_sv
sv_collated <- annotated_sv %>%
dplyr::mutate(
gene = paste("manta", gene, "sv", sep = "_"),
mutated = "POS"
) %>%
dplyr::distinct() %>%
tidyr::pivot_wider(
names_from = gene,
values_from = mutated
) %>%
replace(is.na(.), "NEG")
# Plot SSM + SVs
pretty_circular_mutation_frequency_heatmap(
collated_results = list(sv_collated),
prettyOncoplot_output = oncoplot_output,
these_samples_metadata = metadata
)
}))
 suppressMessages(
suppressWarnings({
regions_bed = GAMBLR.utils::create_bed_data(GAMBLR.data::grch37_ashm_regions,
fix_names = "concat",
concat_cols =c("gene","region"),
sep="-")
# Add aSHM data
ashm_freq <- get_ashm_count_matrix(
these_samples_metadata = metadata,
regions_bed = regions_bed,
this_seq_type = "genome",
projection = "grch37"
)
ashm_freq_collated <- mutate(ashm_freq,across(,~ifelse(.x>0,1,0)))
ashm_freq_collated <- ashm_freq_collated[,colSums(ashm_freq_collated) >130]
ashm_freq_collated <- tibble::rownames_to_column(ashm_freq_collated,
"sample_id")
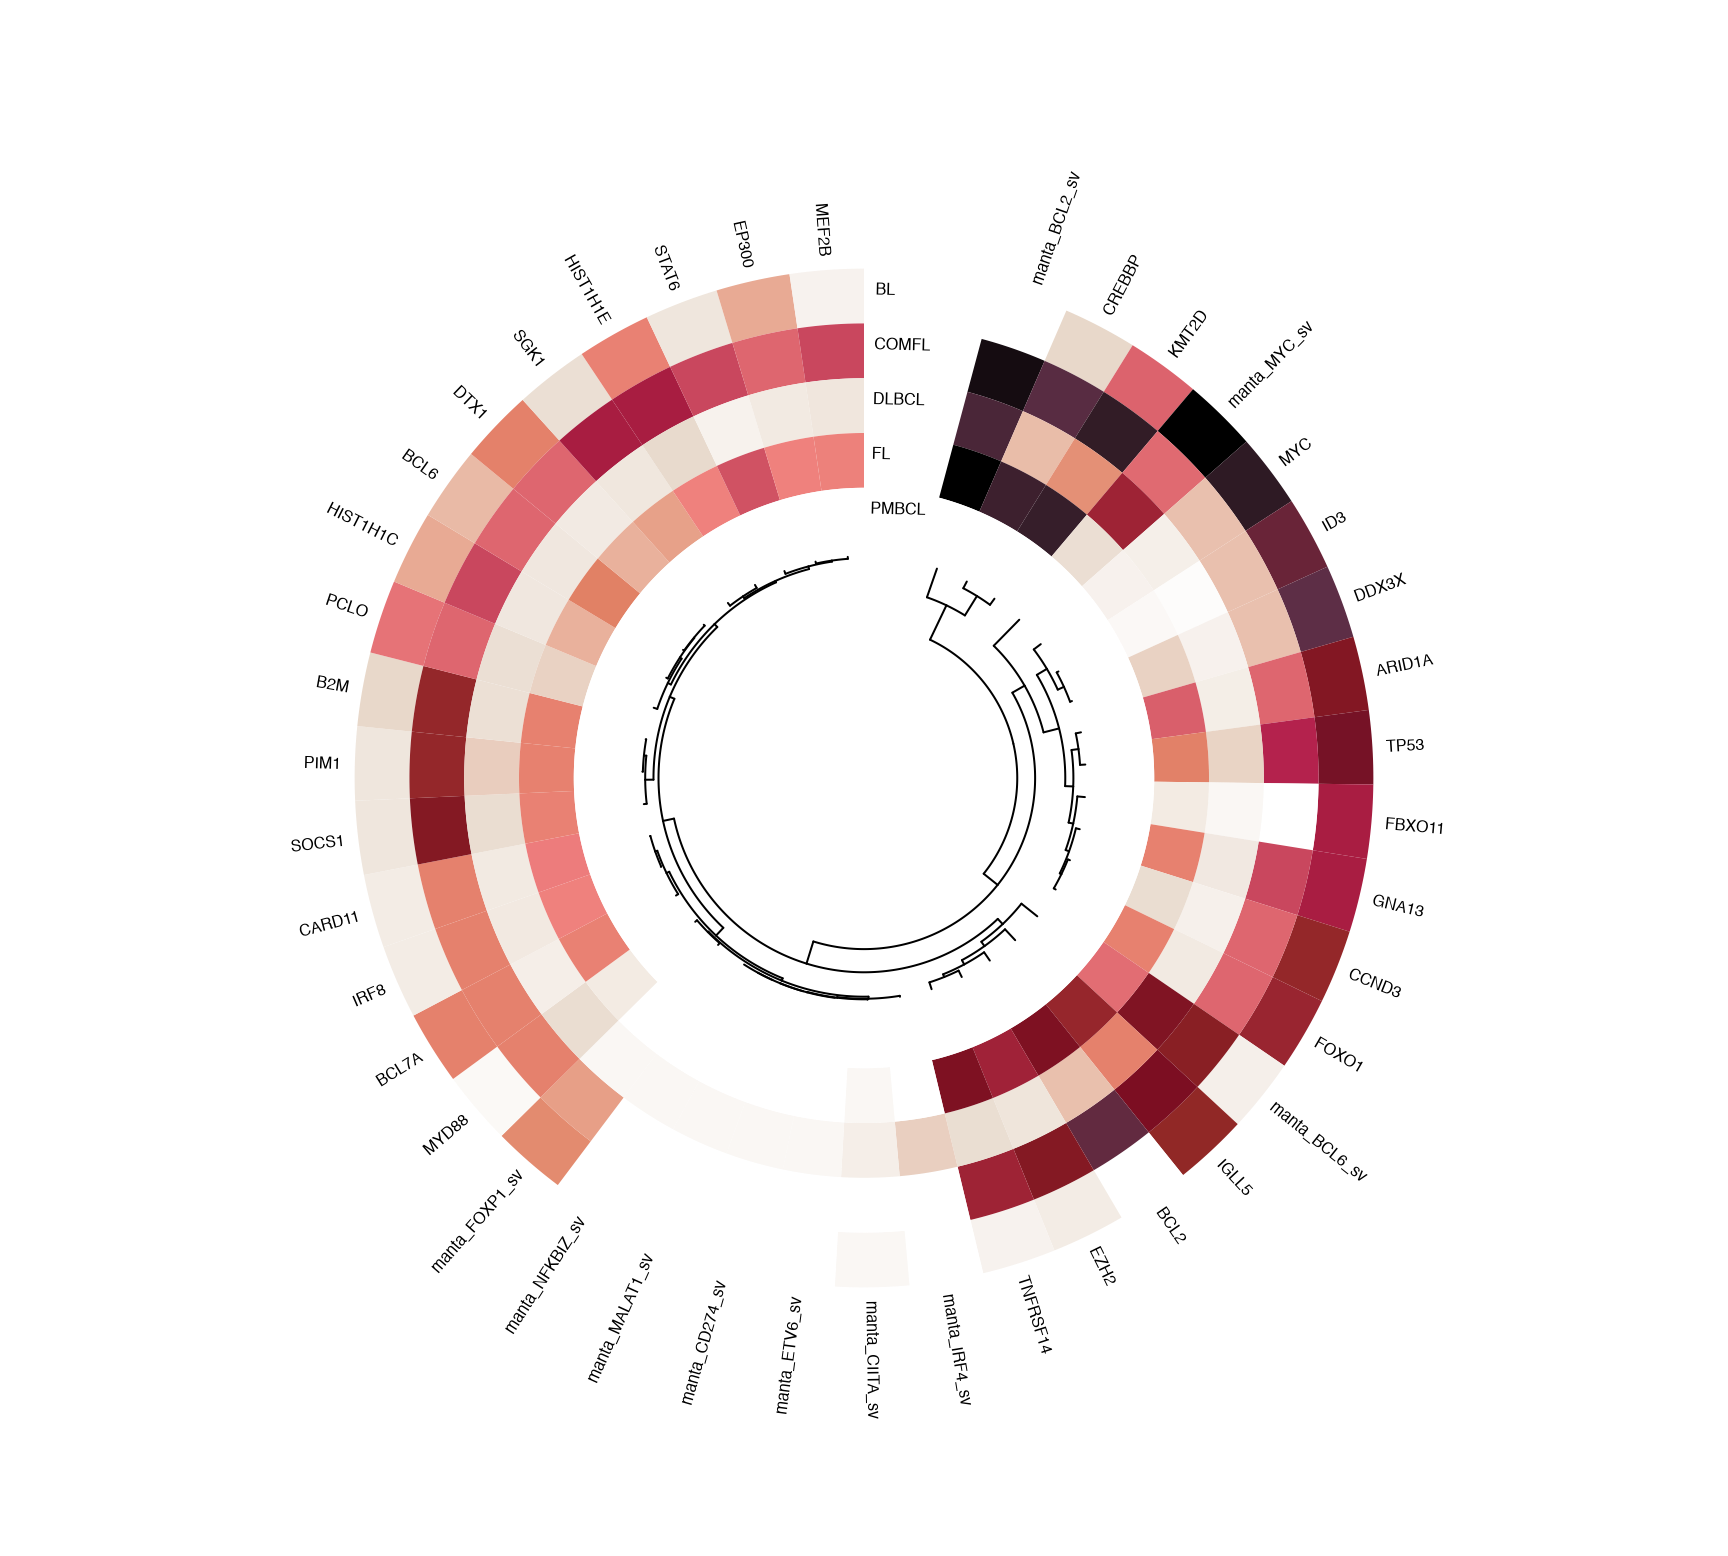
# Comprehensive plot with SSM + SV + aSHM and some non-default arguments
pretty_circular_mutation_frequency_heatmap(
collated_results = list(sv_collated, ashm_freq_collated),
prettyOncoplot_output = oncoplot_output,
these_samples_metadata = metadata,
keep_these_pathologies = c("DLBCL", "FL", "BL"),
split_by_type = TRUE,
colour_labels = TRUE,
label_cex = 0.4,
rownames_cex = 0.4,
include_legend = TRUE
)
}))
suppressMessages(
suppressWarnings({
regions_bed = GAMBLR.utils::create_bed_data(GAMBLR.data::grch37_ashm_regions,
fix_names = "concat",
concat_cols =c("gene","region"),
sep="-")
# Add aSHM data
ashm_freq <- get_ashm_count_matrix(
these_samples_metadata = metadata,
regions_bed = regions_bed,
this_seq_type = "genome",
projection = "grch37"
)
ashm_freq_collated <- mutate(ashm_freq,across(,~ifelse(.x>0,1,0)))
ashm_freq_collated <- ashm_freq_collated[,colSums(ashm_freq_collated) >130]
ashm_freq_collated <- tibble::rownames_to_column(ashm_freq_collated,
"sample_id")
# Comprehensive plot with SSM + SV + aSHM and some non-default arguments
pretty_circular_mutation_frequency_heatmap(
collated_results = list(sv_collated, ashm_freq_collated),
prettyOncoplot_output = oncoplot_output,
these_samples_metadata = metadata,
keep_these_pathologies = c("DLBCL", "FL", "BL"),
split_by_type = TRUE,
colour_labels = TRUE,
label_cex = 0.4,
rownames_cex = 0.4,
include_legend = TRUE
)
}))
