Pretty Copy Number Heatmap
pretty_CN_heatmap.RdPretty Copy Number Heatmap
Usage
pretty_CN_heatmap(
  cn_state_matrix,
  scale_by_sample = FALSE,
  these_samples_metadata,
  keep_sample_order = FALSE,
  metadataColumns = c("pathology"),
  numericMetadataColumns,
  expressionColumns,
  genome_build = "grch37",
  cluster_columns = FALSE,
  cluster_rows = TRUE,
  show_row_names = FALSE,
  show_column_names = FALSE,
  keep_these_chromosomes,
  hide_these_chromosomes,
  keep_these_bins,
  hide_annotations,
  sortByBins,
  sortByGenes,
  splitByBinState,
  sortByPGA = FALSE,
  sortByMetadataColumns,
  labelTheseGenes,
  labelTheseCytobands,
  highlightTheseRegions,
  bin_label_fontsize = 5,
  bin_label_nudge = 1.03,
  bin_label_rotation = 45,
  drop_if_PGA_below = 0,
  drop_if_PGA_above = 1,
  focus_on_these_bins,
  geneBoxPlot,
  show_bottom_annotation_name = FALSE,
  bottom_annotation_name_side = "left",
  left_annotation_name_side = "top",
  bin_labels,
  legend_direction = "horizontal",
  legend_position = "bottom",
  legend_row = 2,
  legend_col = 3,
  metadataBarFontsize = 5,
  metadataBarHeight = 1.5,
  boxplot_orientation = "vertical",
  return_data = FALSE,
  drop_bin_if_sd_below = 0,
  flip = FALSE,
  max_CN_allowed = 6,
  verbose = FALSE,
  rotate = FALSE,
  width = 15,
  height = 6,
  cluster_samples,
  cluster_regions
)
Arguments
- cn_state_matrix
The output of get_cn_states
- scale_by_sample
Set to TRUE to scale CN values within each sample_id
- these_samples_metadata
The output of get_gambl_metadata
- keep_sample_order
FALSE. Set to TRUE to ensure samples are in the same order as in the metadata
- metadataColumns
One or more columns from the metadata you want to display beside the heatmap
- numericMetadataColumns
One or more columns from the metadata that should be considered numeric
- expressionColumns
Optional: One or more columns from the metadata that include gene expression values you want shown
- cluster_columns
Set to TRUE to enable clustering of genomic regions (columns) based on their CN value across all patients in the heatmap
- cluster_rows
Set to TRUE to enable clustering of genomic regions (columns) based on their CN value across all regions in the heatmap
- show_row_names
Set to TRUE to display the ID of every bin (region) shown in the heatmap
- show_column_names
Set to TRUE to display the sample_id of every sample shown in the heatmap
- keep_these_chromosomes
A vector of chromosome names to include (all others will be excluded)
- hide_these_chromosomes
A vector of chromosome names to exclude (all others will be included unless keep_these_chromosomes is specified)
- keep_these_bins
A vector of bin names to include (all others will be excluded)
- hide_annotations
A vector of annotation names to suppress from legends in the plot
- sortByBins
Optional: A vector containing one or more names of genomic bins that will be used to order the heatmap rows.
- splitByBinState
Optional: A single genomic bin that will be used to split the heatmap based on the CN state of that bin
- sortByPGA
Optional: Sort the rows based on percent genome altered (PGA) instead of the other options
- sortByMetadataColumns
A vector containing one or more names of columns from your metadata that will be used to order the rows overall or within slices (if combined with splitByBinState or geneBoxPlot)
- labelTheseGenes
A vector of Hugo gene symbols whose location will be indicated on the top of the heatmap
- bin_label_fontsize
Font size for the gene labels (default 5)
- bin_label_nudge
Increase or decrease this value to shift the gene labels up/down (default 1.03)
- bin_label_rotation
Rotate the direction of the bin label. Default is 45.
- drop_if_PGA_below
Lower limit for proportion of genome altered (PGA). Samples below this value will be dropped (default 0)
- drop_if_PGA_above
Upper limit for proportion of genome altered (PGA). Samples above this value will be dropped (default 1)
- focus_on_these_bins
Mask all regions outside these bins (set CN to 0). Useful for visualizing GISTIC results.
- geneBoxPlot
Optional: Specify the Hugo symbol of a single gene to embed box plots adjacent to the heatmap. Expression data for this gene must be present in the metadata in a column of the same name.
- show_bottom_annotation_name
set to TRUE to label the bottom annotation tracks with more details
- bottom_annotation_name_side
If using show_bottom_annotation_name, set this to "left" or "right" to relocate the names
- left_annotation_name_side
Which side to put the name of the metadata annotations (top or bottom)
- bin_labels
Instead of automatically labeling genes, you can instead explicitly provide a list of labels for any bins in the heatmap. The names of each element should match a bin. The value of each element is the label that will be shown. This option can be used to skip gene location look-ups (see examples).
- legend_direction
Which orientation to use for the legend
- legend_position
Where to put the legend
- legend_row
How many rows for the legend layout
- legend_col
How many columns for the legend layout
- boxplot_orientation
Either "horizontal" or "vertical" (default: horizontal)
- return_data
Specify TRUE to get some of the internal data back including the heatmap object
- drop_bin_if_sd_below
Force bins with standard deviation below this value to be excluded
- verbose
Control verbosity of the console output. Default is FALSE.
- rotate
Optionally, flip the rows/columns of resulting heatmap. Default is FALSE.
- width
Set the width of the heatmap. Default is 10.
- cluster_samples
More intuitive alias for cluster_rows, especially when combining with rotate = TRUE
- cluster_regions
More intuitive alias for cluster_columns
Examples
suppressMessages(library(dplyr))
suppressMessages(library(GAMBLR.open))
#get some metadata for subsetting the data to just one pathology (DLBCL)
dlbcl_genome_meta = suppressMessages(get_gambl_metadata()) %>%
filter(pathology=="DLBCL",
seq_type=="genome")
#remove any duplicate sample_id/seq_type combinations
meta_clean = check_and_clean_metadata(dlbcl_genome_meta,
duplicate_action = "keep_first")
#> Duplicate rows (keeping first occurrence) for 'sample_id' and 'seq_type' have been dropped.
# Create the copy number matrix using the helper functions
all_segments = get_cn_segments(these = meta_clean)
#> Using the bundled CN segments (.seg) calls in GAMBLR.data...
dlbcl_cn_binned = segmented_data_to_cn_matrix(
seg_data = all_segments,
strategy="auto_split",
n_bins_split=1300,
these_samples_metadata = meta_clean)
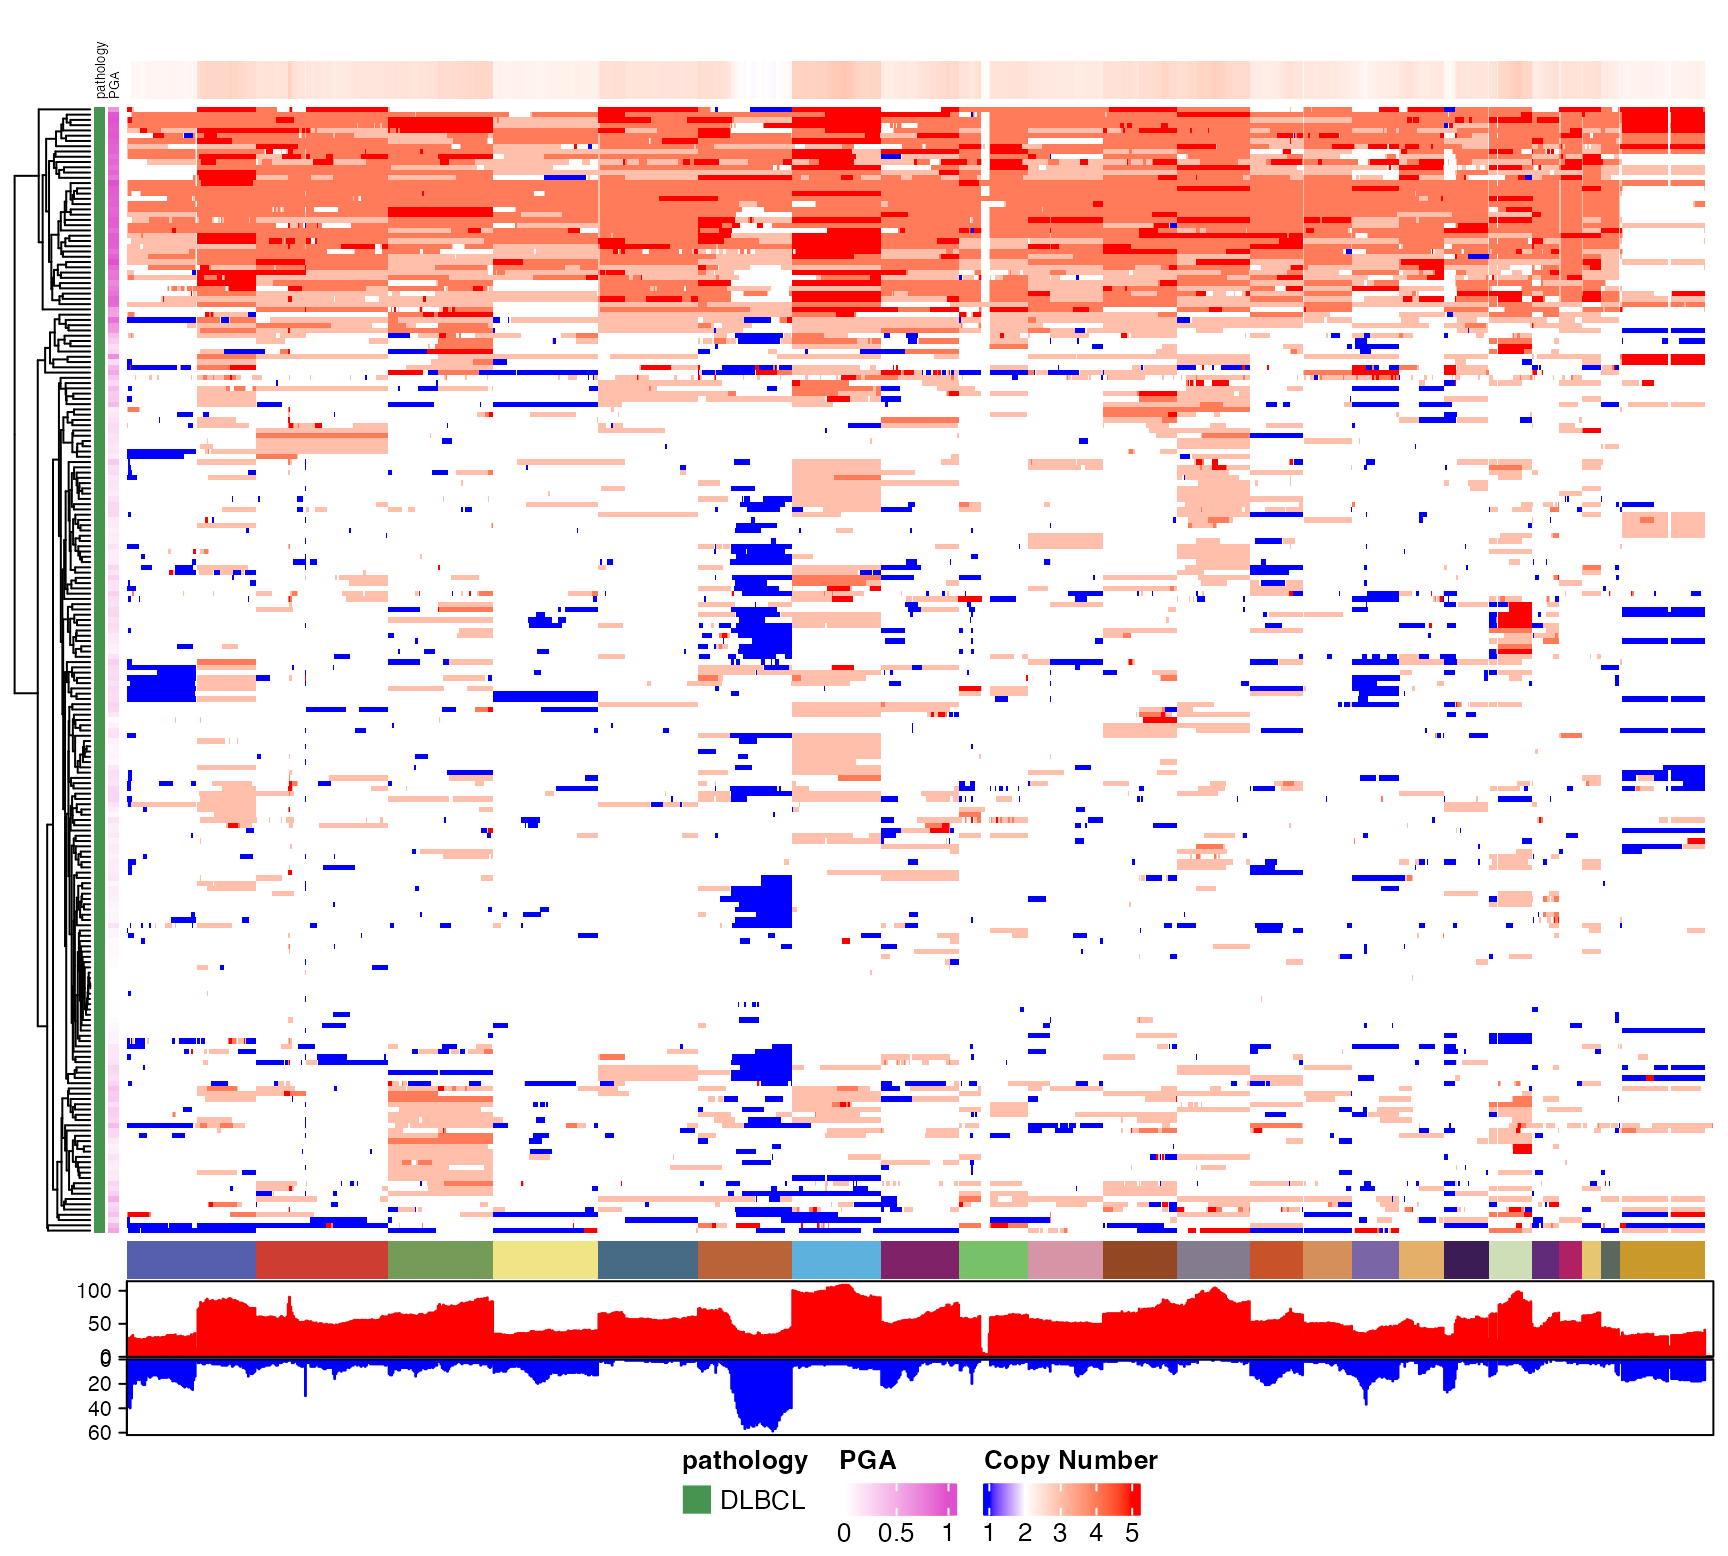
# Generate a basic genome-wide CN heatmap
pretty_CN_heatmap(cn_state_matrix=dlbcl_cn_binned,
these_samples_metadata = meta_clean,
hide_annotations = "chromosome")
#> Warning: The input is a data frame-like object, convert it to a matrix.
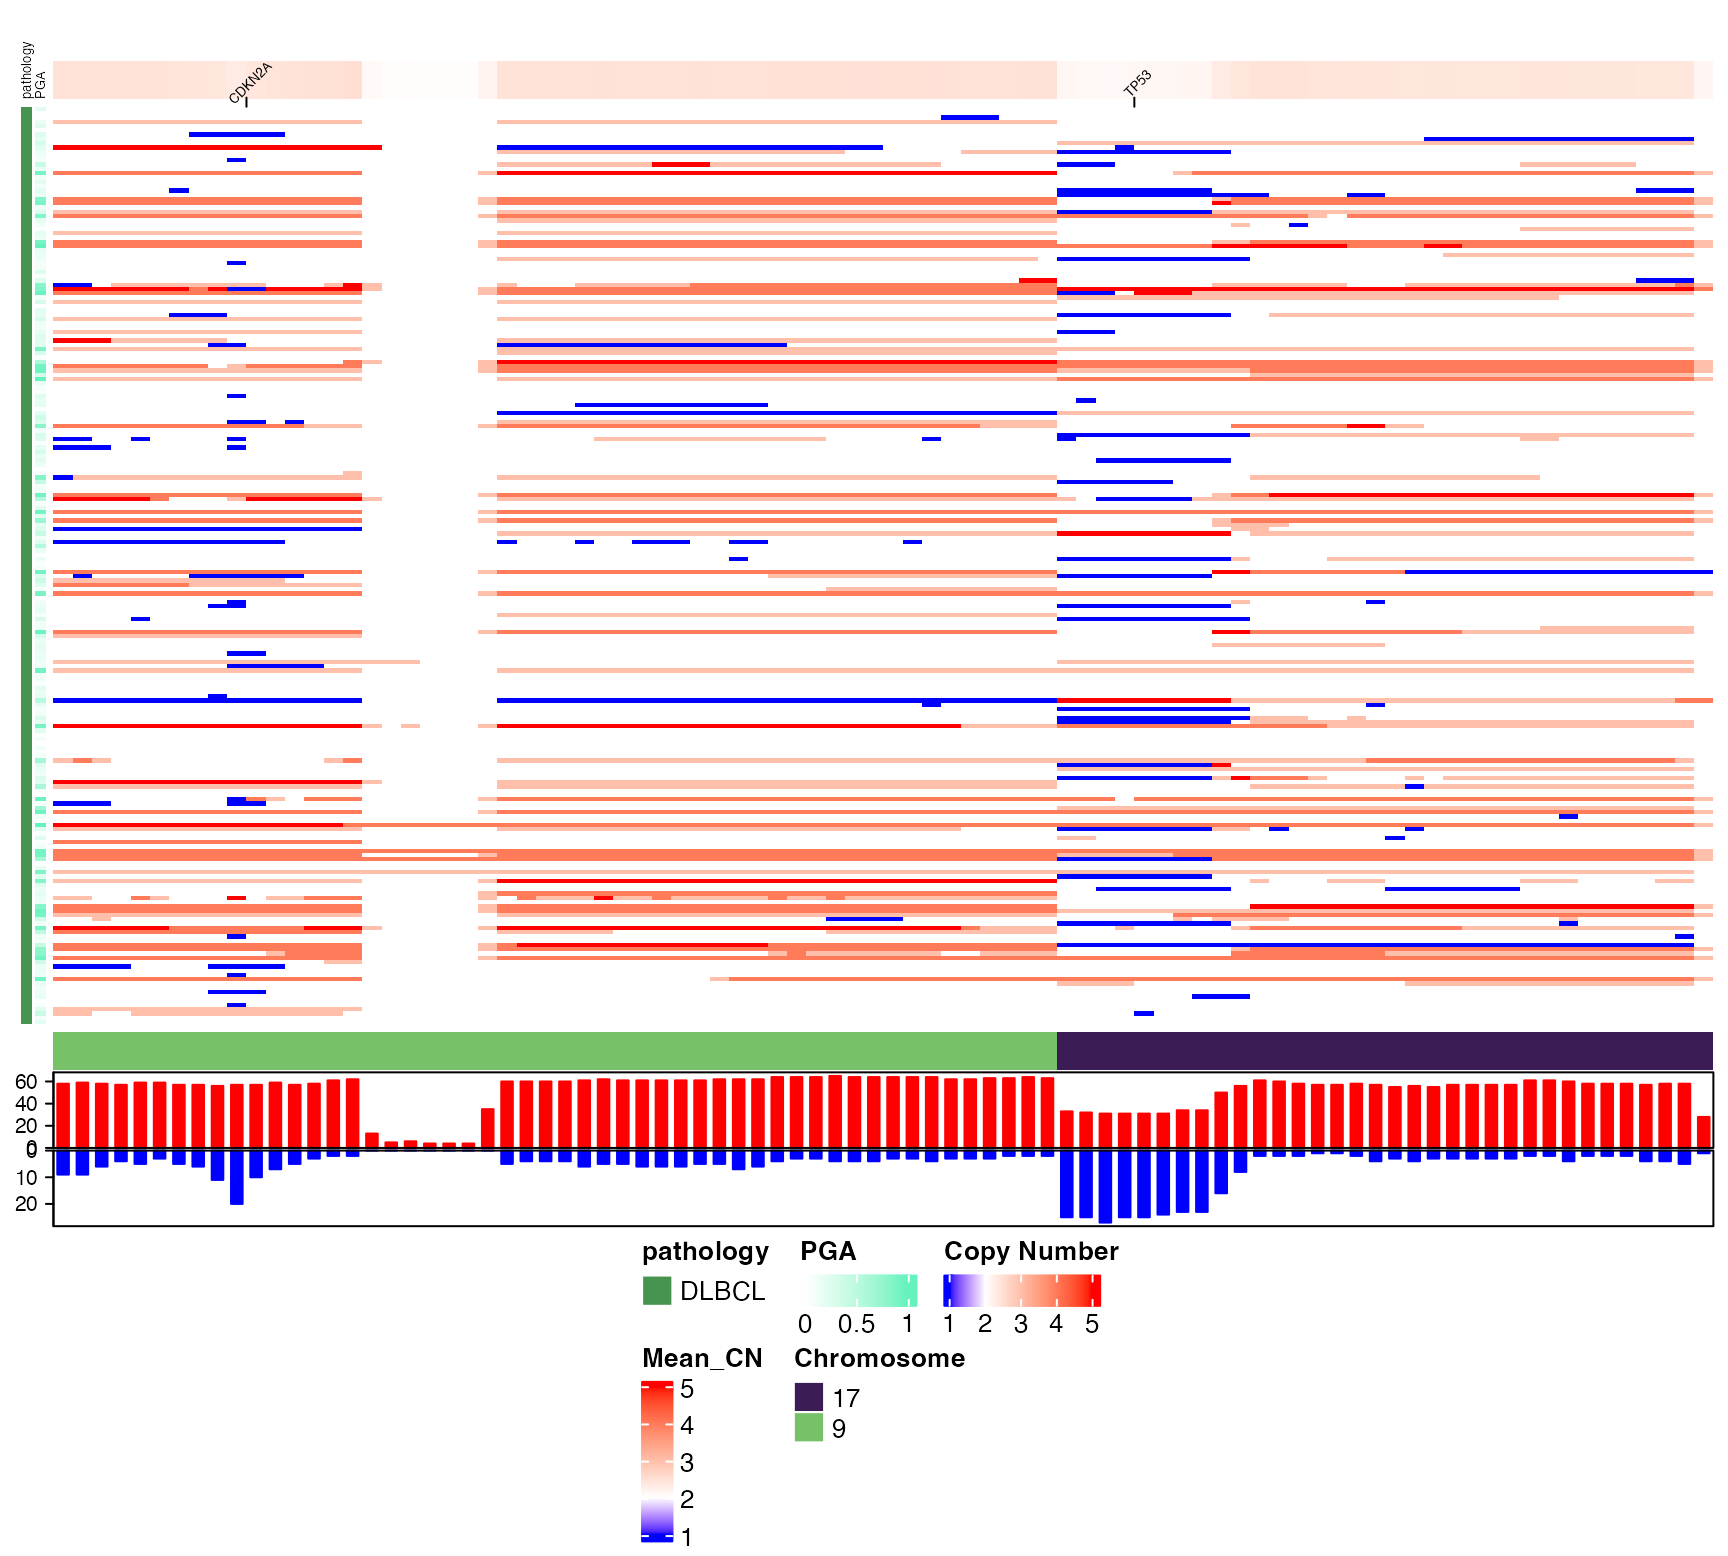
 # Disable row (sample) clustering and restrict to a few chromosomes
# and highlight some genes of interest
pretty_CN_heatmap(cn_state_matrix=dlbcl_cn_binned,
these_samples_metadata = meta_clean,
hide_annotations = "chromosomes",
keep_these_chromosomes = c("9","17"),
cluster_rows=FALSE,
labelTheseGenes = c("CDKN2A","TP53"))
#> mapping genes to bins
#> Warning: The input is a data frame-like object, convert it to a matrix.
# Disable row (sample) clustering and restrict to a few chromosomes
# and highlight some genes of interest
pretty_CN_heatmap(cn_state_matrix=dlbcl_cn_binned,
these_samples_metadata = meta_clean,
hide_annotations = "chromosomes",
keep_these_chromosomes = c("9","17"),
cluster_rows=FALSE,
labelTheseGenes = c("CDKN2A","TP53"))
#> mapping genes to bins
#> Warning: The input is a data frame-like object, convert it to a matrix.
 if (FALSE) { # \dontrun{
# get gene expression data
gene_exp_all = get_gene_expression(all_genes=T,
lazy_join=T,
arbitrarily_pick = TRUE,
HGNC=T,format="wide")
genome_meta_exp = left_join(get_gambl_metadata() %>%
dplyr::filter(seq_type=="genome") %>%
dplyr::select(sample_id,pathology,lymphgen),
dplyr::select(gene_exp_all,-sample_id),
by=c("sample_id"="genome_sample_id")) %>%
filter(!is.na(MYC))
} # }
# Include gene expression data and embed a box plot showing the expression of one gene across different CN states
if (FALSE) { # \dontrun{
pretty_CN_heatmap(cn_state_matrix=all_states_binned,
these_samples_metadata = filter(genome_meta_exp,pathology=="DLBCL"),
hide_annotations = "chromosomes",
cluster_rows=F,
geneBoxPlot = "TP53",
boxplot_orientation="horizontal",bin_label_fontsize = 9,bin_label_nudge = 19
)
} # }
if (FALSE) { # \dontrun{
# get gene expression data
gene_exp_all = get_gene_expression(all_genes=T,
lazy_join=T,
arbitrarily_pick = TRUE,
HGNC=T,format="wide")
genome_meta_exp = left_join(get_gambl_metadata() %>%
dplyr::filter(seq_type=="genome") %>%
dplyr::select(sample_id,pathology,lymphgen),
dplyr::select(gene_exp_all,-sample_id),
by=c("sample_id"="genome_sample_id")) %>%
filter(!is.na(MYC))
} # }
# Include gene expression data and embed a box plot showing the expression of one gene across different CN states
if (FALSE) { # \dontrun{
pretty_CN_heatmap(cn_state_matrix=all_states_binned,
these_samples_metadata = filter(genome_meta_exp,pathology=="DLBCL"),
hide_annotations = "chromosomes",
cluster_rows=F,
geneBoxPlot = "TP53",
boxplot_orientation="horizontal",bin_label_fontsize = 9,bin_label_nudge = 19
)
} # }