Pretty stacked oncoplot
prettyStackedOncoplot.RdPretty stacked oncoplot
Usage
prettyStackedOncoplot(
  these_samples_metadata,
  maf_data,
  metadataColumns = "pathology",
  sortByMetadataColumns,
  seg_data,
  sortByPGA = FALSE,
  cn_state_matrix = NULL,
  ashm_matrix,
  regions_bed,
  genes,
  sortByGenes,
  genes_CN_thresh,
  secondPlotType = "pretty_CN_heatmap",
  oncoplot_location = "top",
  cluster_samples = FALSE,
  secondPlotArgs,
  oncoplotArgs,
  returnEverything = FALSE,
  plot_width = 15,
  oncoplotHeight = 6,
  secondPlotHeight = 6,
  verbose = FALSE,
  row_names_side = "right",
  pctFontSize = 0
)
Arguments
- these_samples_metadata
A metadata data frame with sample_id as a column. The order of sample IDs in the rows of this data frame will dictate the order of samples in the oncoplot.
- maf_data
A data frame with maf data that will be used to populate the oncoplot. Required parameter.
- metadataColumns
A character vector of column names that specifies which columns from these_samples_metadata will be displayed below the oncoplot.
- secondPlotType
Defaults to pretty_CN_heatmap, which is currently the only option tested with this function.
- verbose
Set to TRUE for ultra chatty mode
Examples
suppressMessages(
suppressWarnings({
library(GAMBLR.open)
# Prepare some metadata
dlbcl_genome_meta = get_gambl_metadata() %>%
dplyr::filter(pathology=="DLBCL",
seq_type=="genome") %>%
check_and_clean_metadata(.,duplicate_action="keep_first")
# Get CN segments for these samples
dlbcl_seg = get_cn_segments(dlbcl_genome_meta)
# Prepare CN matrix
cn_mat = segmented_data_to_cn_matrix(dlbcl_seg,
these = dlbcl_genome_meta,
adjust_for_ploidy = TRUE)
dlbcl_maf = get_all_coding_ssm(dlbcl_genome_meta)
}))
genes=c("KMT2D","BCL2","CREBBP","EZH2","MYD88","CD79B","TP53",
"PIM1","CARD11","SGK1","SOCS1",'TET2',"SPEN",
"ETV6","CD83","B2M","S1PR2","GNA13","BTG1",
"BTG2","DDX3X","KLHL6","HIST1H1E","TBL1XR1","SMARCA4")
# we will only sort on the mutation status of these
# genes and in this order
sortGenes = c("TP53","KMT2D","BCL2","EZH2","MYD88","CD79B")
CN_thresh = c("REL"=4,
"CDKN2A"=1,
"MIR17HG"=4,
"TP53"=1,
"TNFRSF14"=1,
"TNFAIP3"=1)
# oncoplot on top with column order dicted by the mutation status
# of sortGenes (in the order of the genes appearance in that vector)
suppressMessages(
suppressWarnings({
prettyStackedOncoplot(these_samples_metadata = dlbcl_genome_meta,
maf_data = dlbcl_maf,
metadataColumns = c("pathology","lymphgen"),
sortByMetadataColumns = c("pathology","lymphgen"),
cn_state_matrix = cn_mat,
genes_CN_thresh = CN_thresh,
genes = genes,
sortByGenes = sortGenes)
}))
 #> NULL
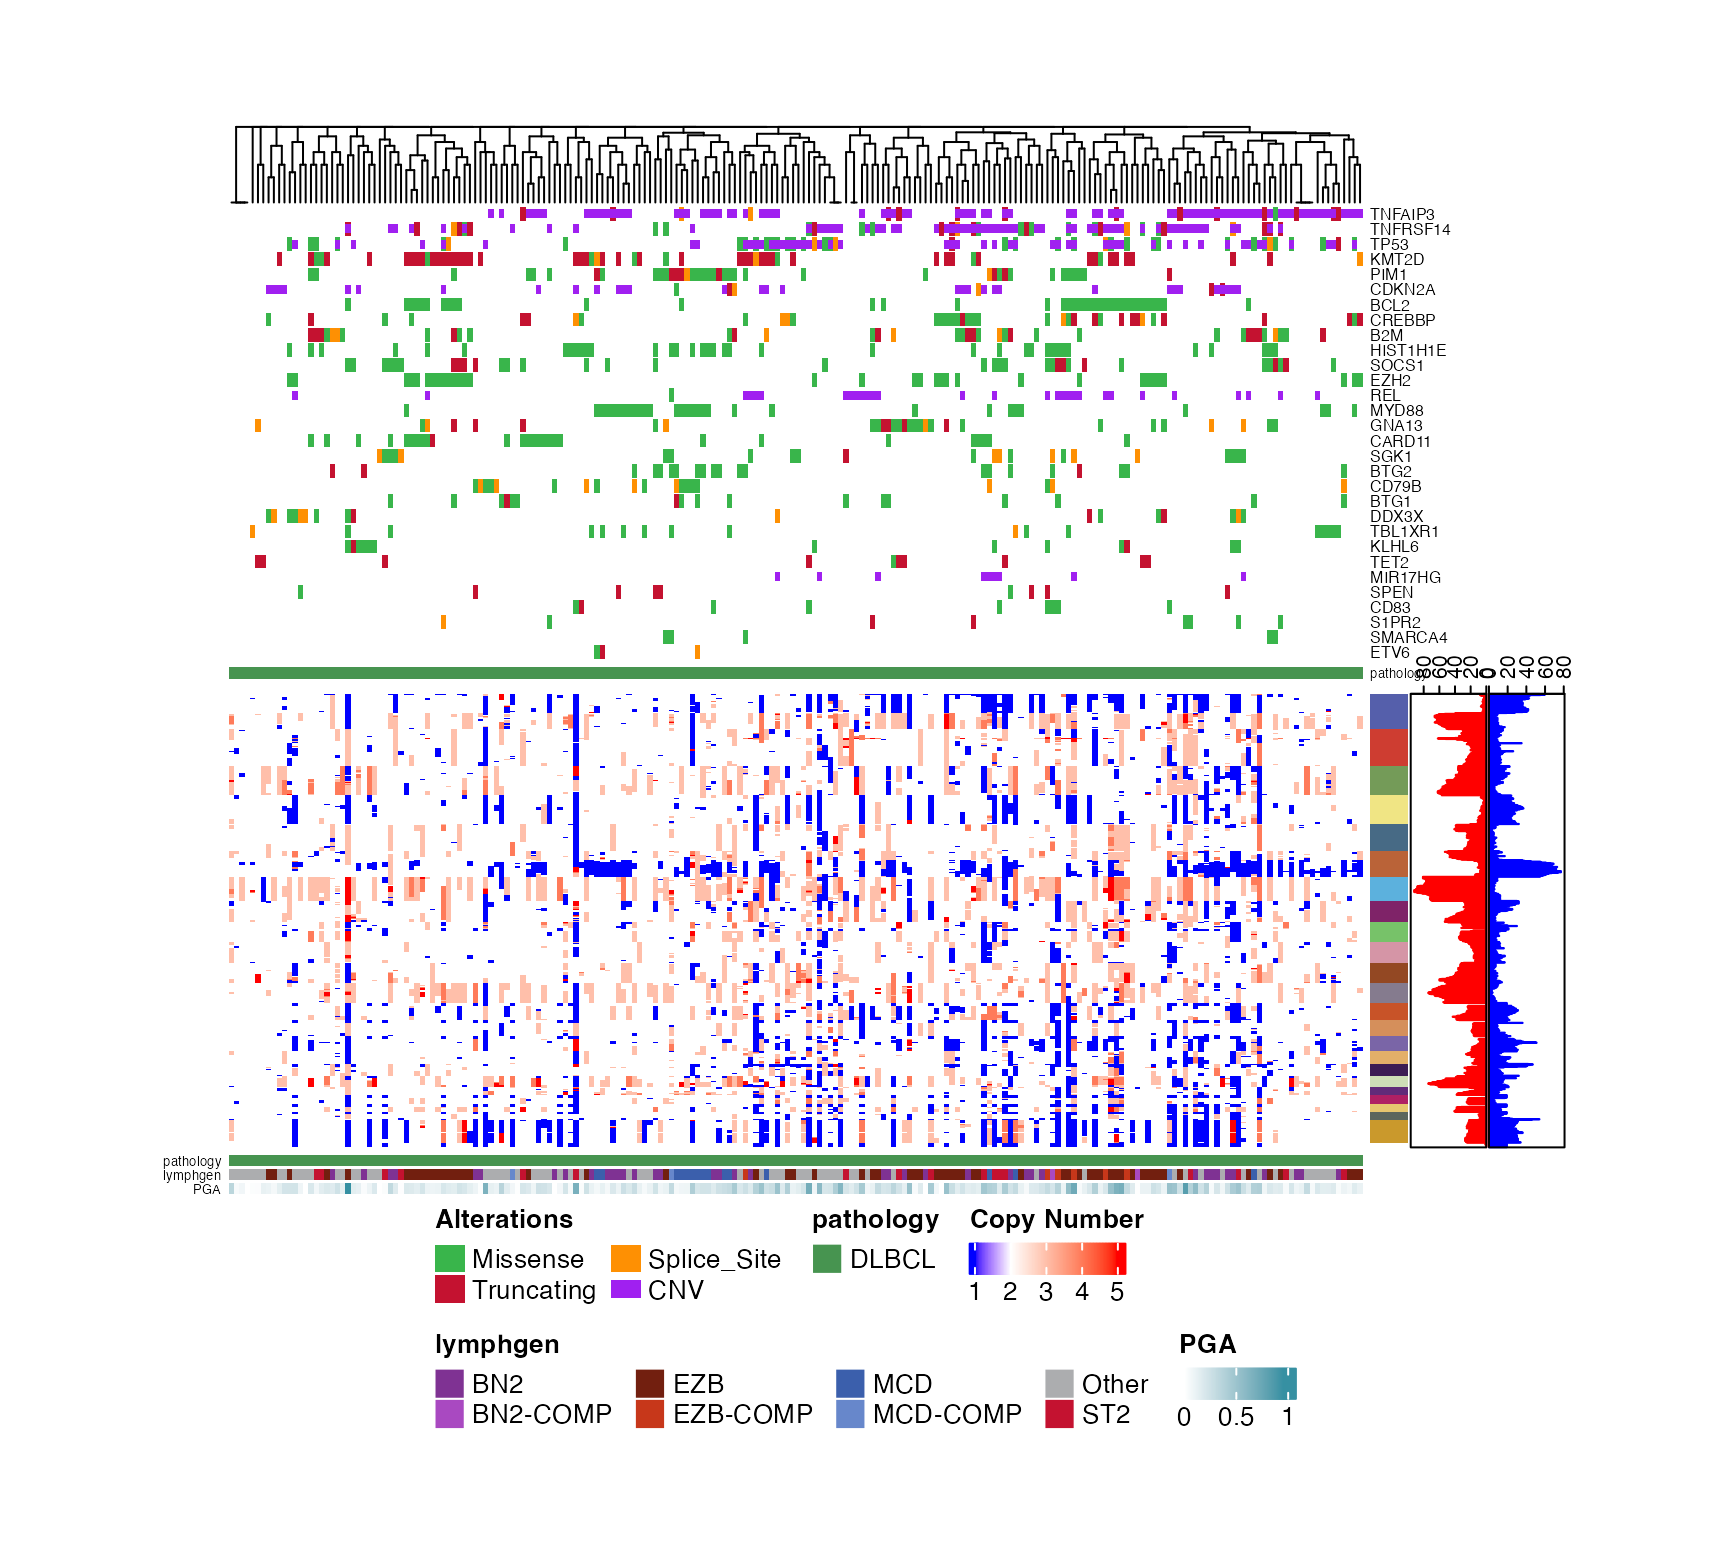
# oncoplot on top. Clustering of mutations is used to order the columns.
suppressMessages(
suppressWarnings({
prettyStackedOncoplot(these_samples_metadata = dlbcl_genome_meta,
maf_data = dlbcl_maf,
metadataColumns = c("pathology","lymphgen"),
cluster_samples = TRUE,
cn_state_matrix = cn_mat,
genes_CN_thresh = CN_thresh,
genes = genes)
}))
#> NULL
# oncoplot on top. Clustering of mutations is used to order the columns.
suppressMessages(
suppressWarnings({
prettyStackedOncoplot(these_samples_metadata = dlbcl_genome_meta,
maf_data = dlbcl_maf,
metadataColumns = c("pathology","lymphgen"),
cluster_samples = TRUE,
cn_state_matrix = cn_mat,
genes_CN_thresh = CN_thresh,
genes = genes)
}))
 #> NULL
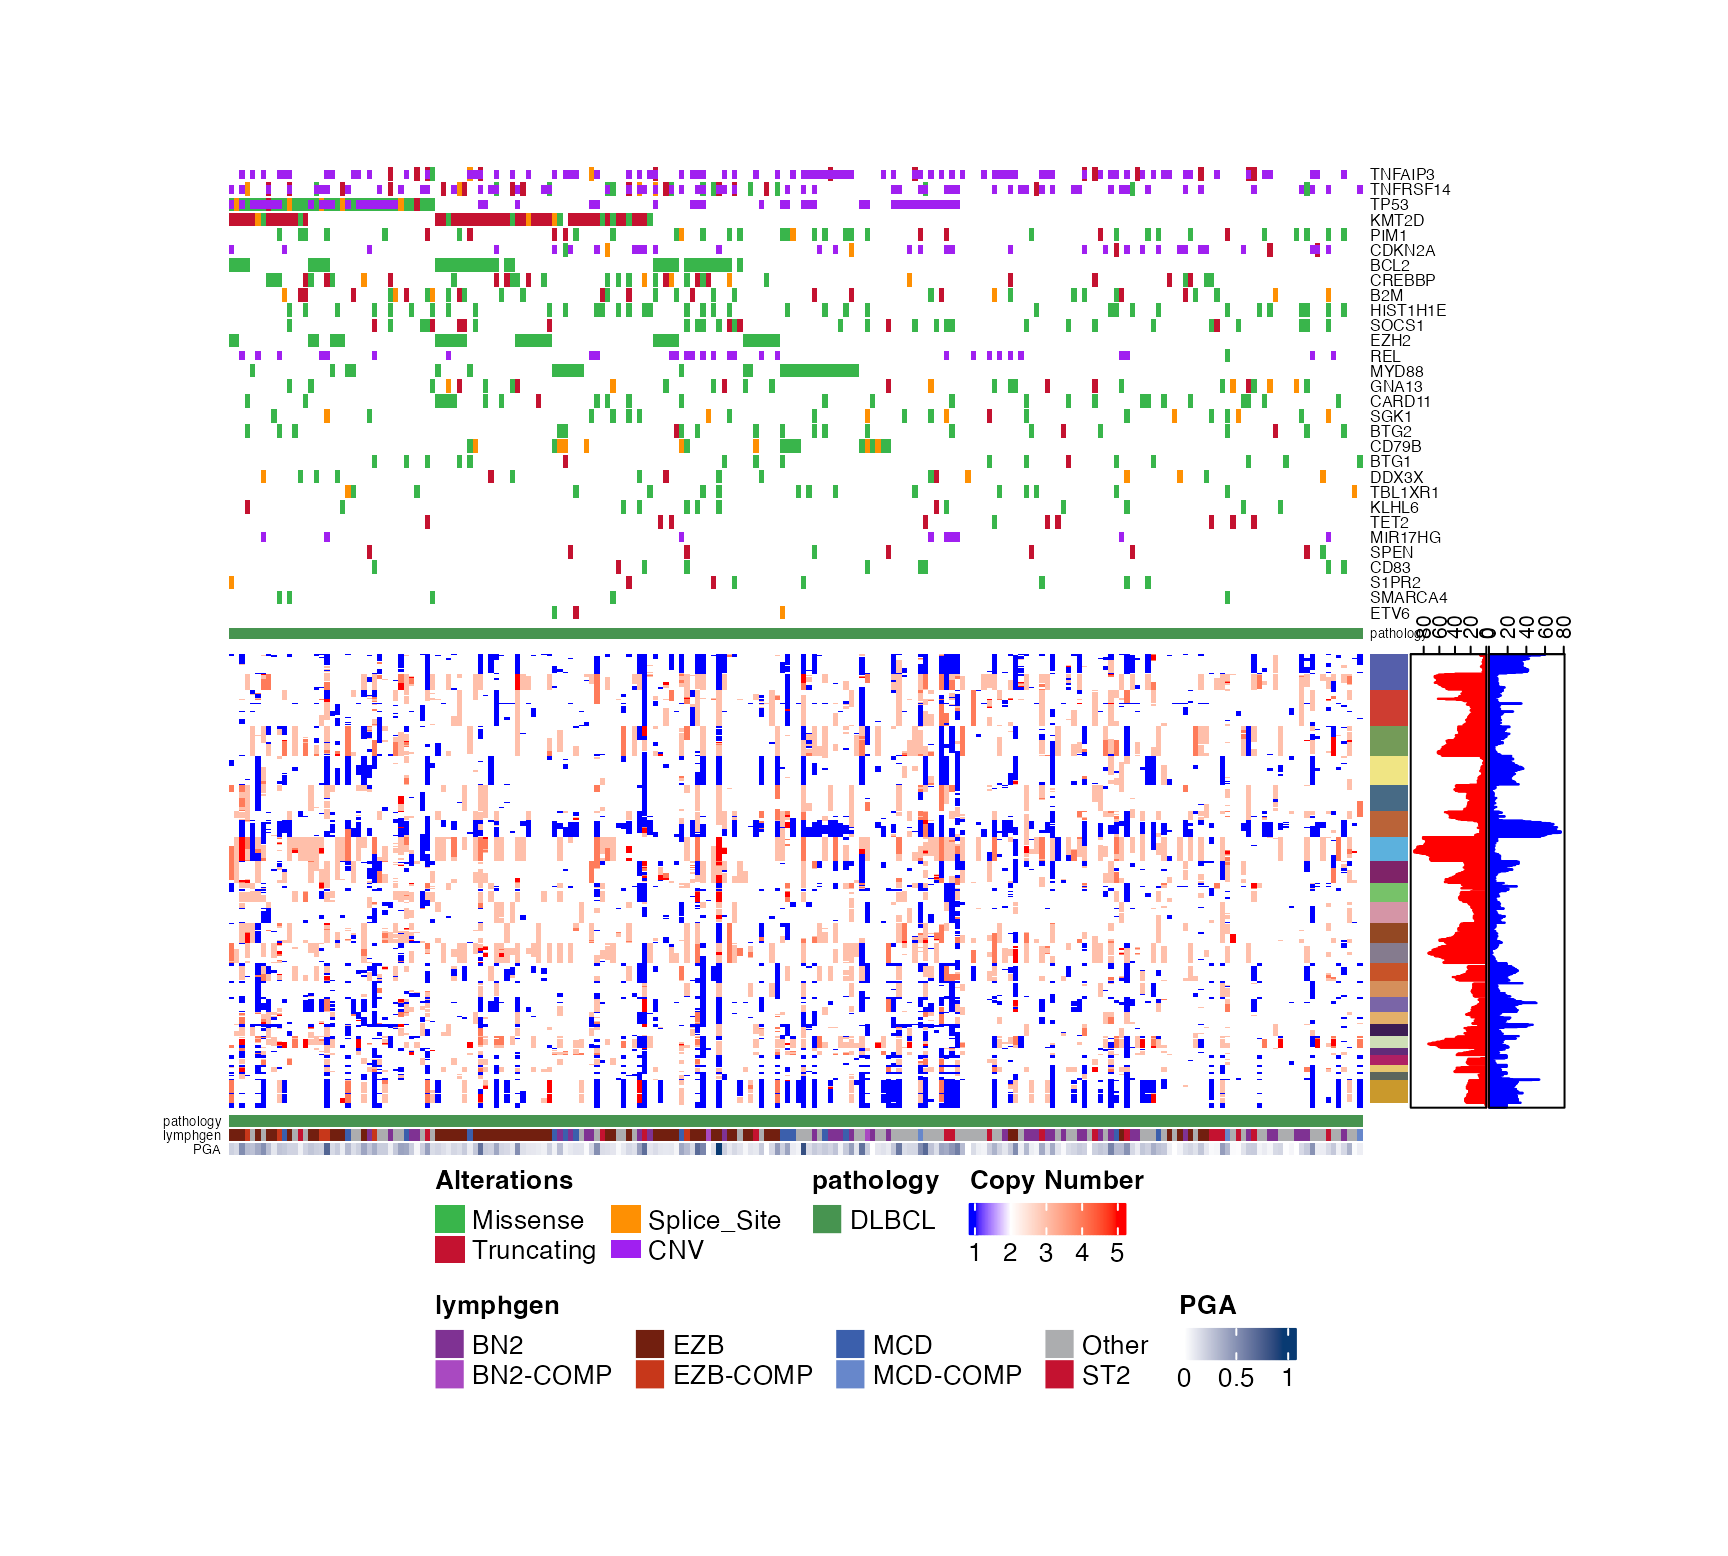
# make a list of arguments for the second (here, the upper) plot
CN_args = list("keep_these_chromosomes"=c("2"),
"scale_by_sample" = TRUE)
suppressMessages(
suppressWarnings({
prettyStackedOncoplot(these_samples_metadata = dlbcl_genome_meta,
maf_data = dlbcl_maf,
sortByGenes = "REL",
metadataColumns = c("pathology","lymphgen"),
oncoplot_location = "bottom",
secondPlotArgs = CN_args,
cn_state_matrix = cn_mat,
genes_CN_thresh = CN_thresh,
genes = genes,
oncoplotHeight = 8,
secondPlotHeight=3)
}))
#> [1] "REL_cn"
#> [1] "sample_id" "TNFRSF14_cn" "REL_cn" "TNFAIP3_cn" "CDKN2A_cn"
#> [6] "MIR17HG_cn" "TP53_cn"
#> NULL
# make a list of arguments for the second (here, the upper) plot
CN_args = list("keep_these_chromosomes"=c("2"),
"scale_by_sample" = TRUE)
suppressMessages(
suppressWarnings({
prettyStackedOncoplot(these_samples_metadata = dlbcl_genome_meta,
maf_data = dlbcl_maf,
sortByGenes = "REL",
metadataColumns = c("pathology","lymphgen"),
oncoplot_location = "bottom",
secondPlotArgs = CN_args,
cn_state_matrix = cn_mat,
genes_CN_thresh = CN_thresh,
genes = genes,
oncoplotHeight = 8,
secondPlotHeight=3)
}))
#> [1] "REL_cn"
#> [1] "sample_id" "TNFRSF14_cn" "REL_cn" "TNFAIP3_cn" "CDKN2A_cn"
#> [6] "MIR17HG_cn" "TP53_cn"
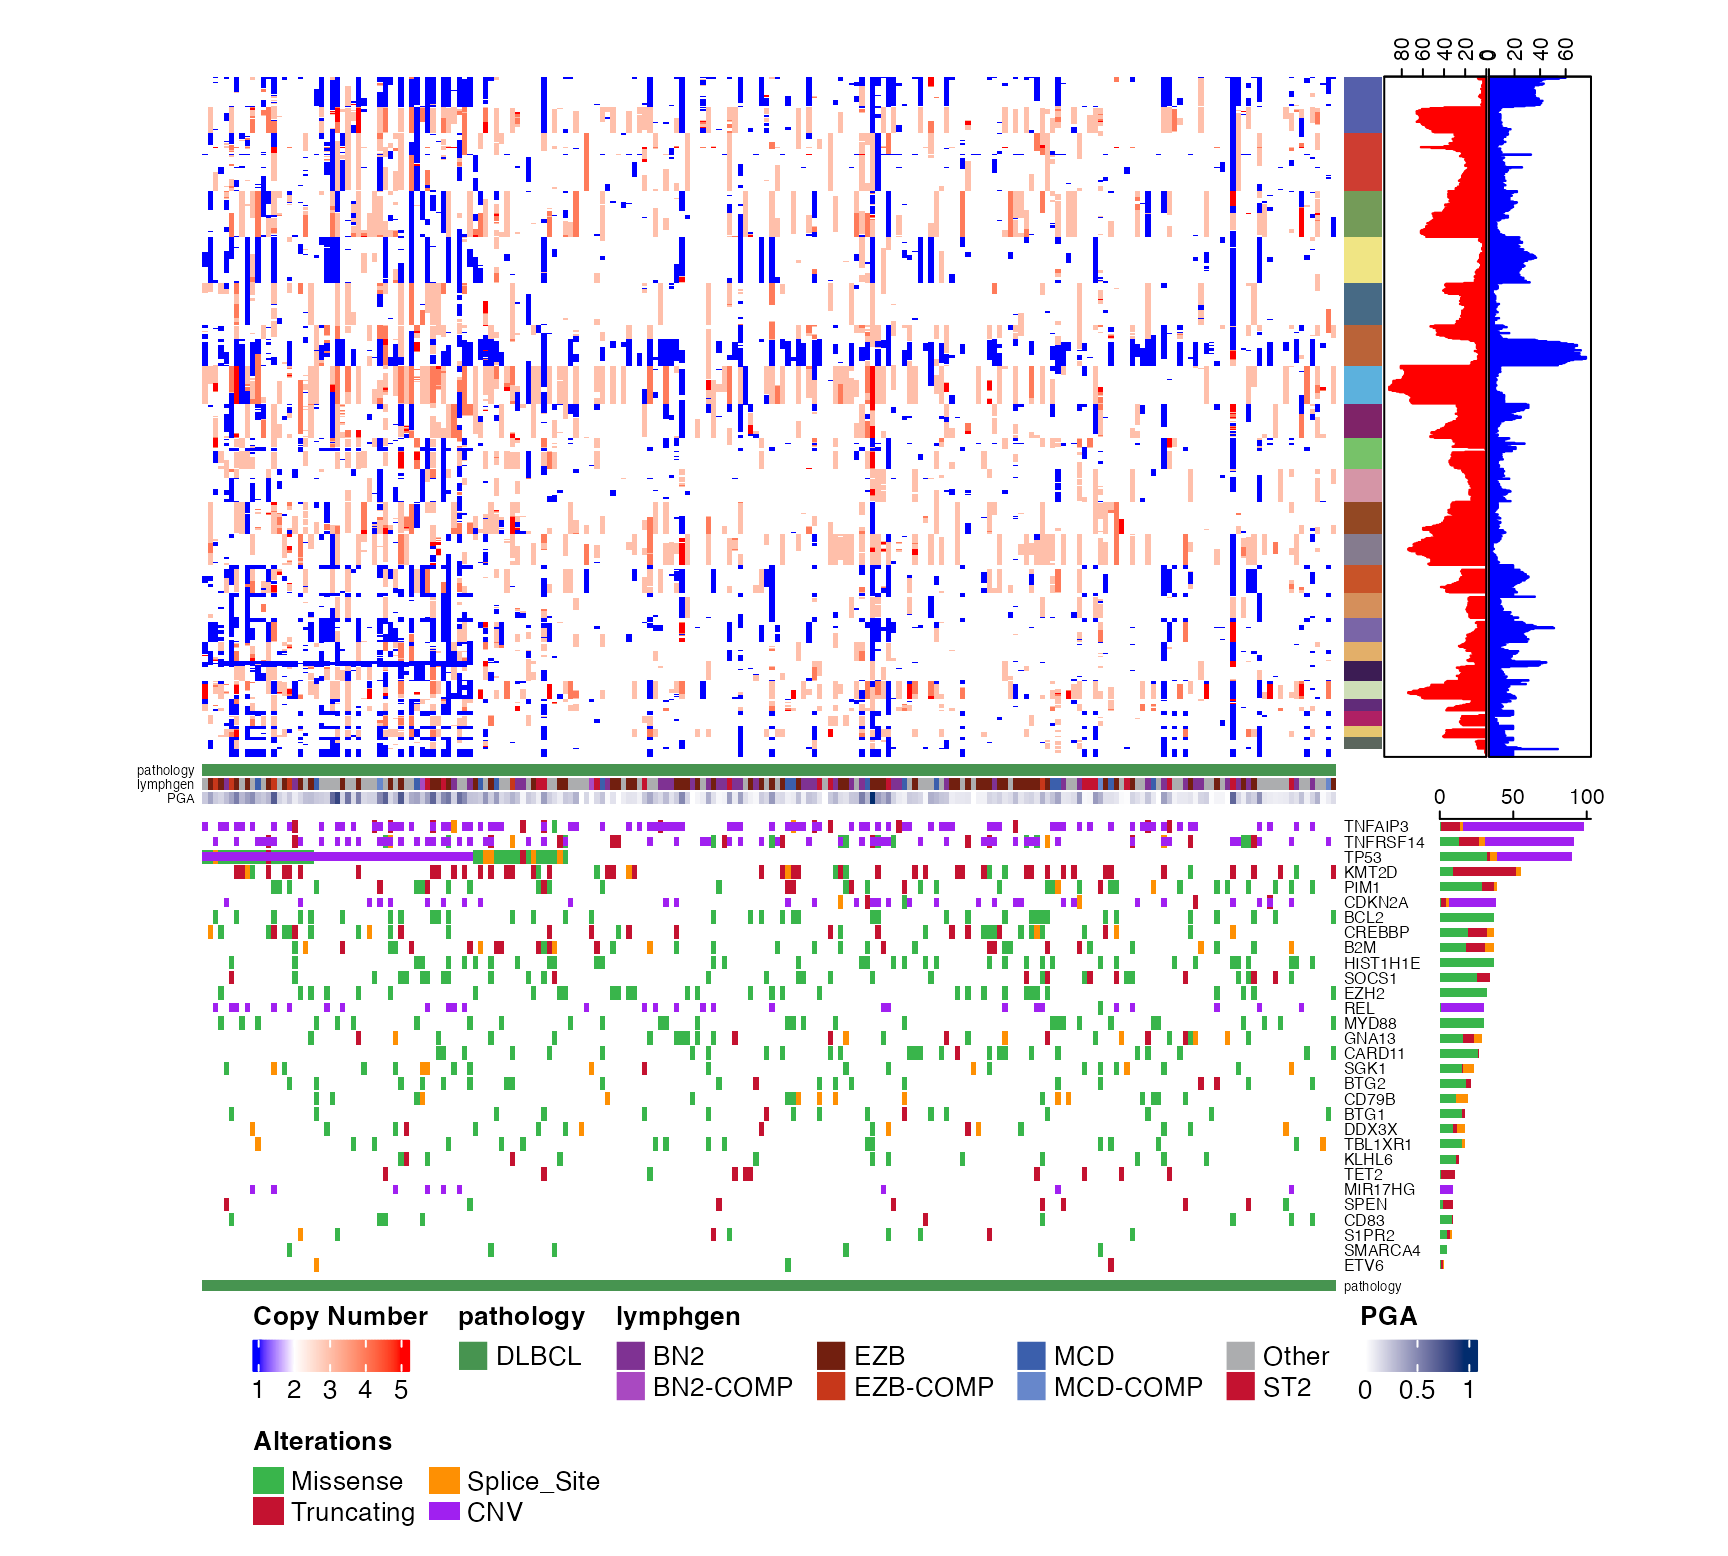
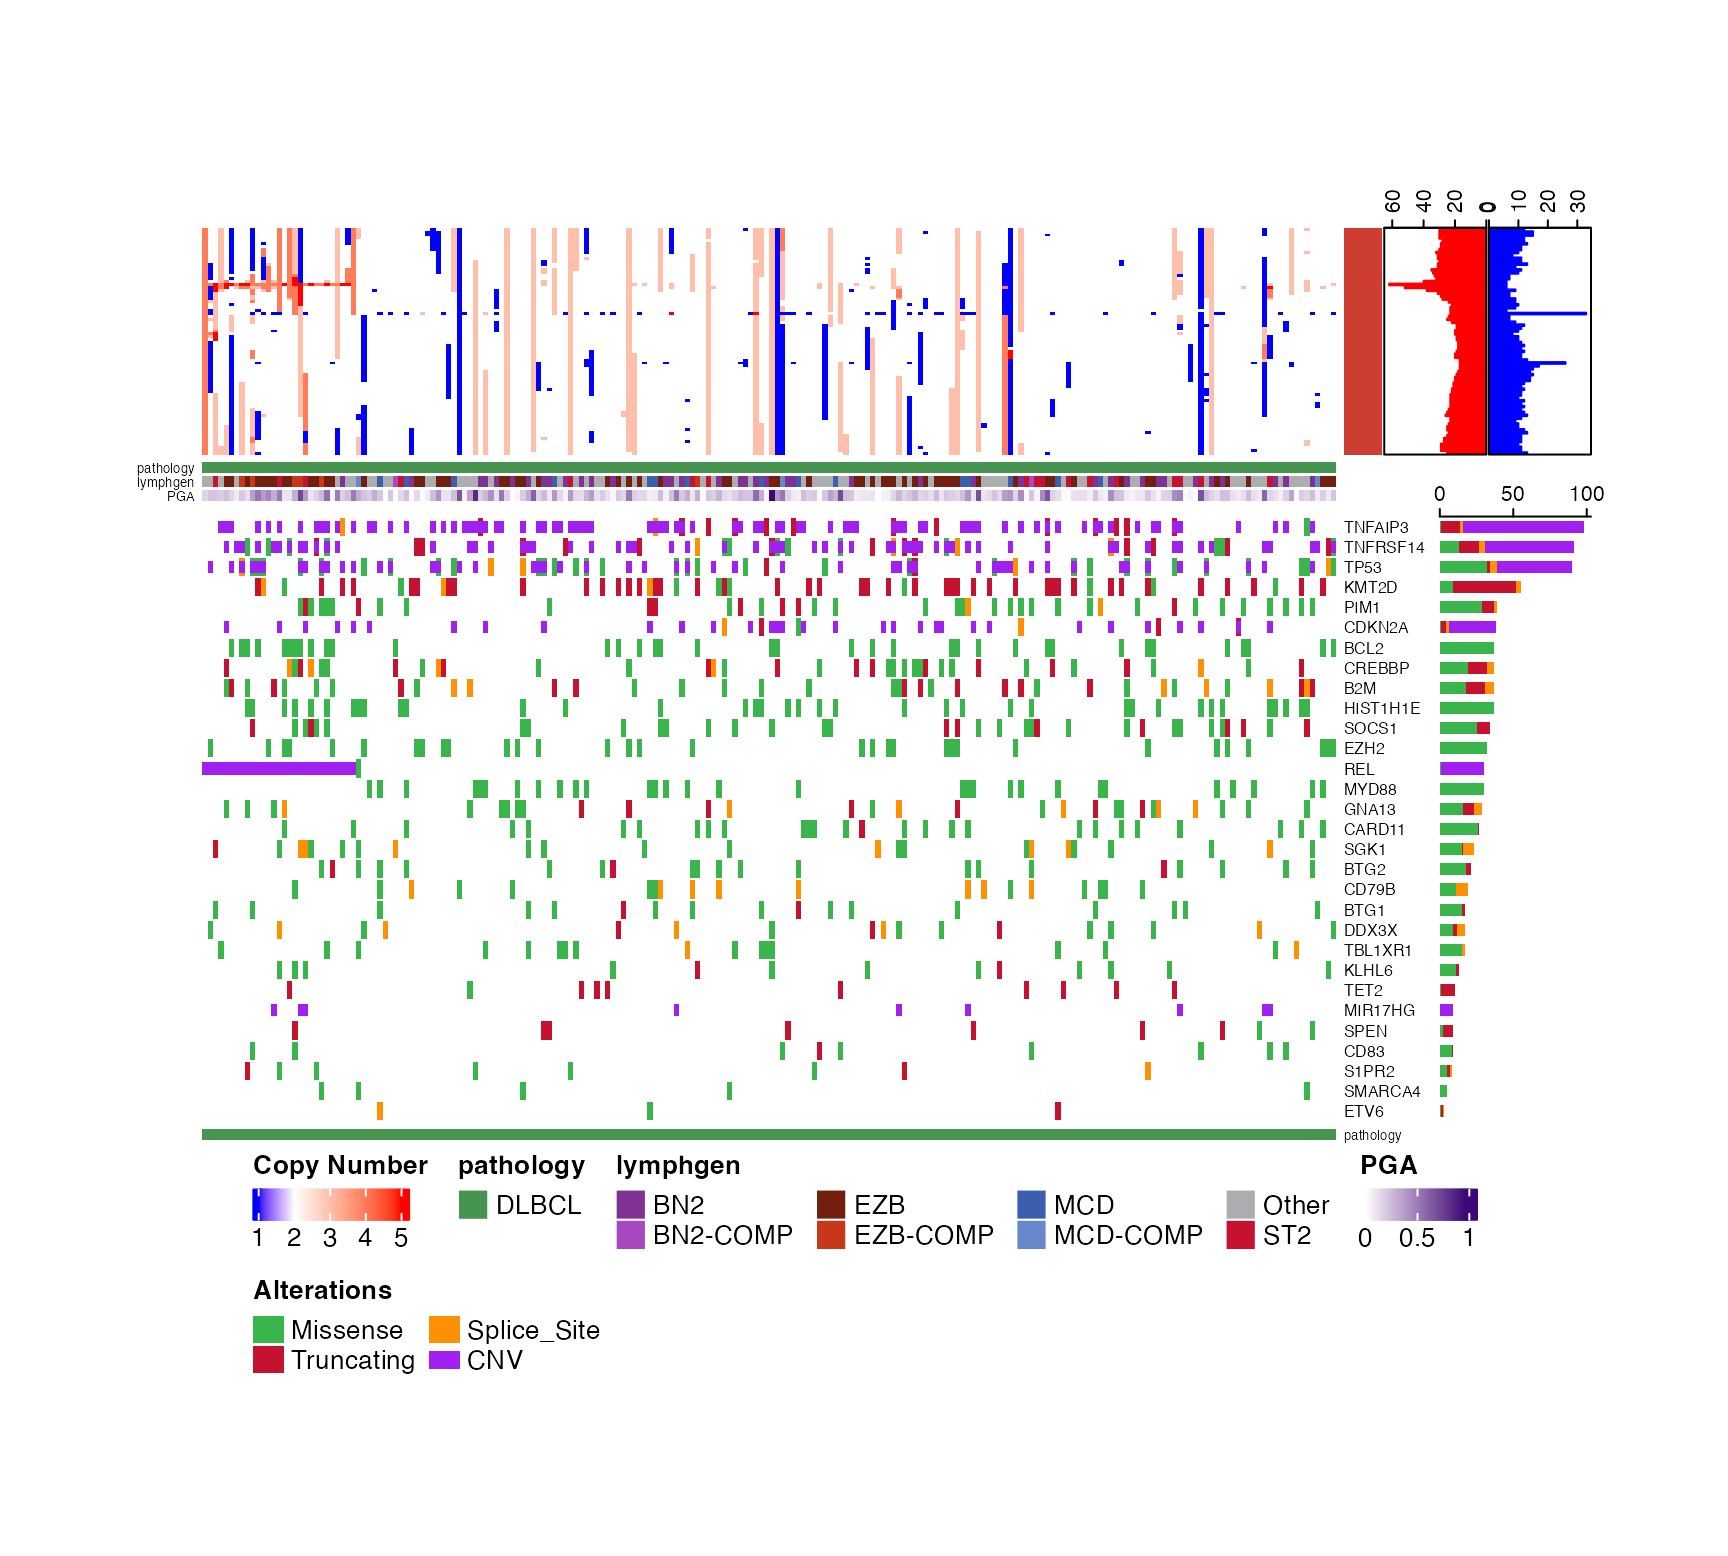 # make a list of arguments for the second (here, the upper) plot
CN_args = list(
"scale_by_sample" = TRUE,
"hide_these_chromosomes" = "X")
# Specifying sortByGenes automatically ensures those genes
# are sorted by their CN status then mutation status when
# oncoplot_location is "bottom".
# The order in the upper plot restricts the order of the lower plot.
suppressMessages(
suppressWarnings({
prettyStackedOncoplot(these_samples_metadata = dlbcl_genome_meta,
maf_data = dlbcl_maf,
sortByGenes = "TP53",
metadataColumns = c("pathology","lymphgen"),
oncoplot_location = "bottom",
secondPlotArgs = CN_args,
cn_state_matrix = cn_mat,
genes_CN_thresh = CN_thresh,
genes = genes,
secondPlotHeight=9)
}))
#> [1] "TP53_cn"
#> [1] "sample_id" "TNFRSF14_cn" "REL_cn" "TNFAIP3_cn" "CDKN2A_cn"
#> [6] "MIR17HG_cn" "TP53_cn"
# make a list of arguments for the second (here, the upper) plot
CN_args = list(
"scale_by_sample" = TRUE,
"hide_these_chromosomes" = "X")
# Specifying sortByGenes automatically ensures those genes
# are sorted by their CN status then mutation status when
# oncoplot_location is "bottom".
# The order in the upper plot restricts the order of the lower plot.
suppressMessages(
suppressWarnings({
prettyStackedOncoplot(these_samples_metadata = dlbcl_genome_meta,
maf_data = dlbcl_maf,
sortByGenes = "TP53",
metadataColumns = c("pathology","lymphgen"),
oncoplot_location = "bottom",
secondPlotArgs = CN_args,
cn_state_matrix = cn_mat,
genes_CN_thresh = CN_thresh,
genes = genes,
secondPlotHeight=9)
}))
#> [1] "TP53_cn"
#> [1] "sample_id" "TNFRSF14_cn" "REL_cn" "TNFAIP3_cn" "CDKN2A_cn"
#> [6] "MIR17HG_cn" "TP53_cn"
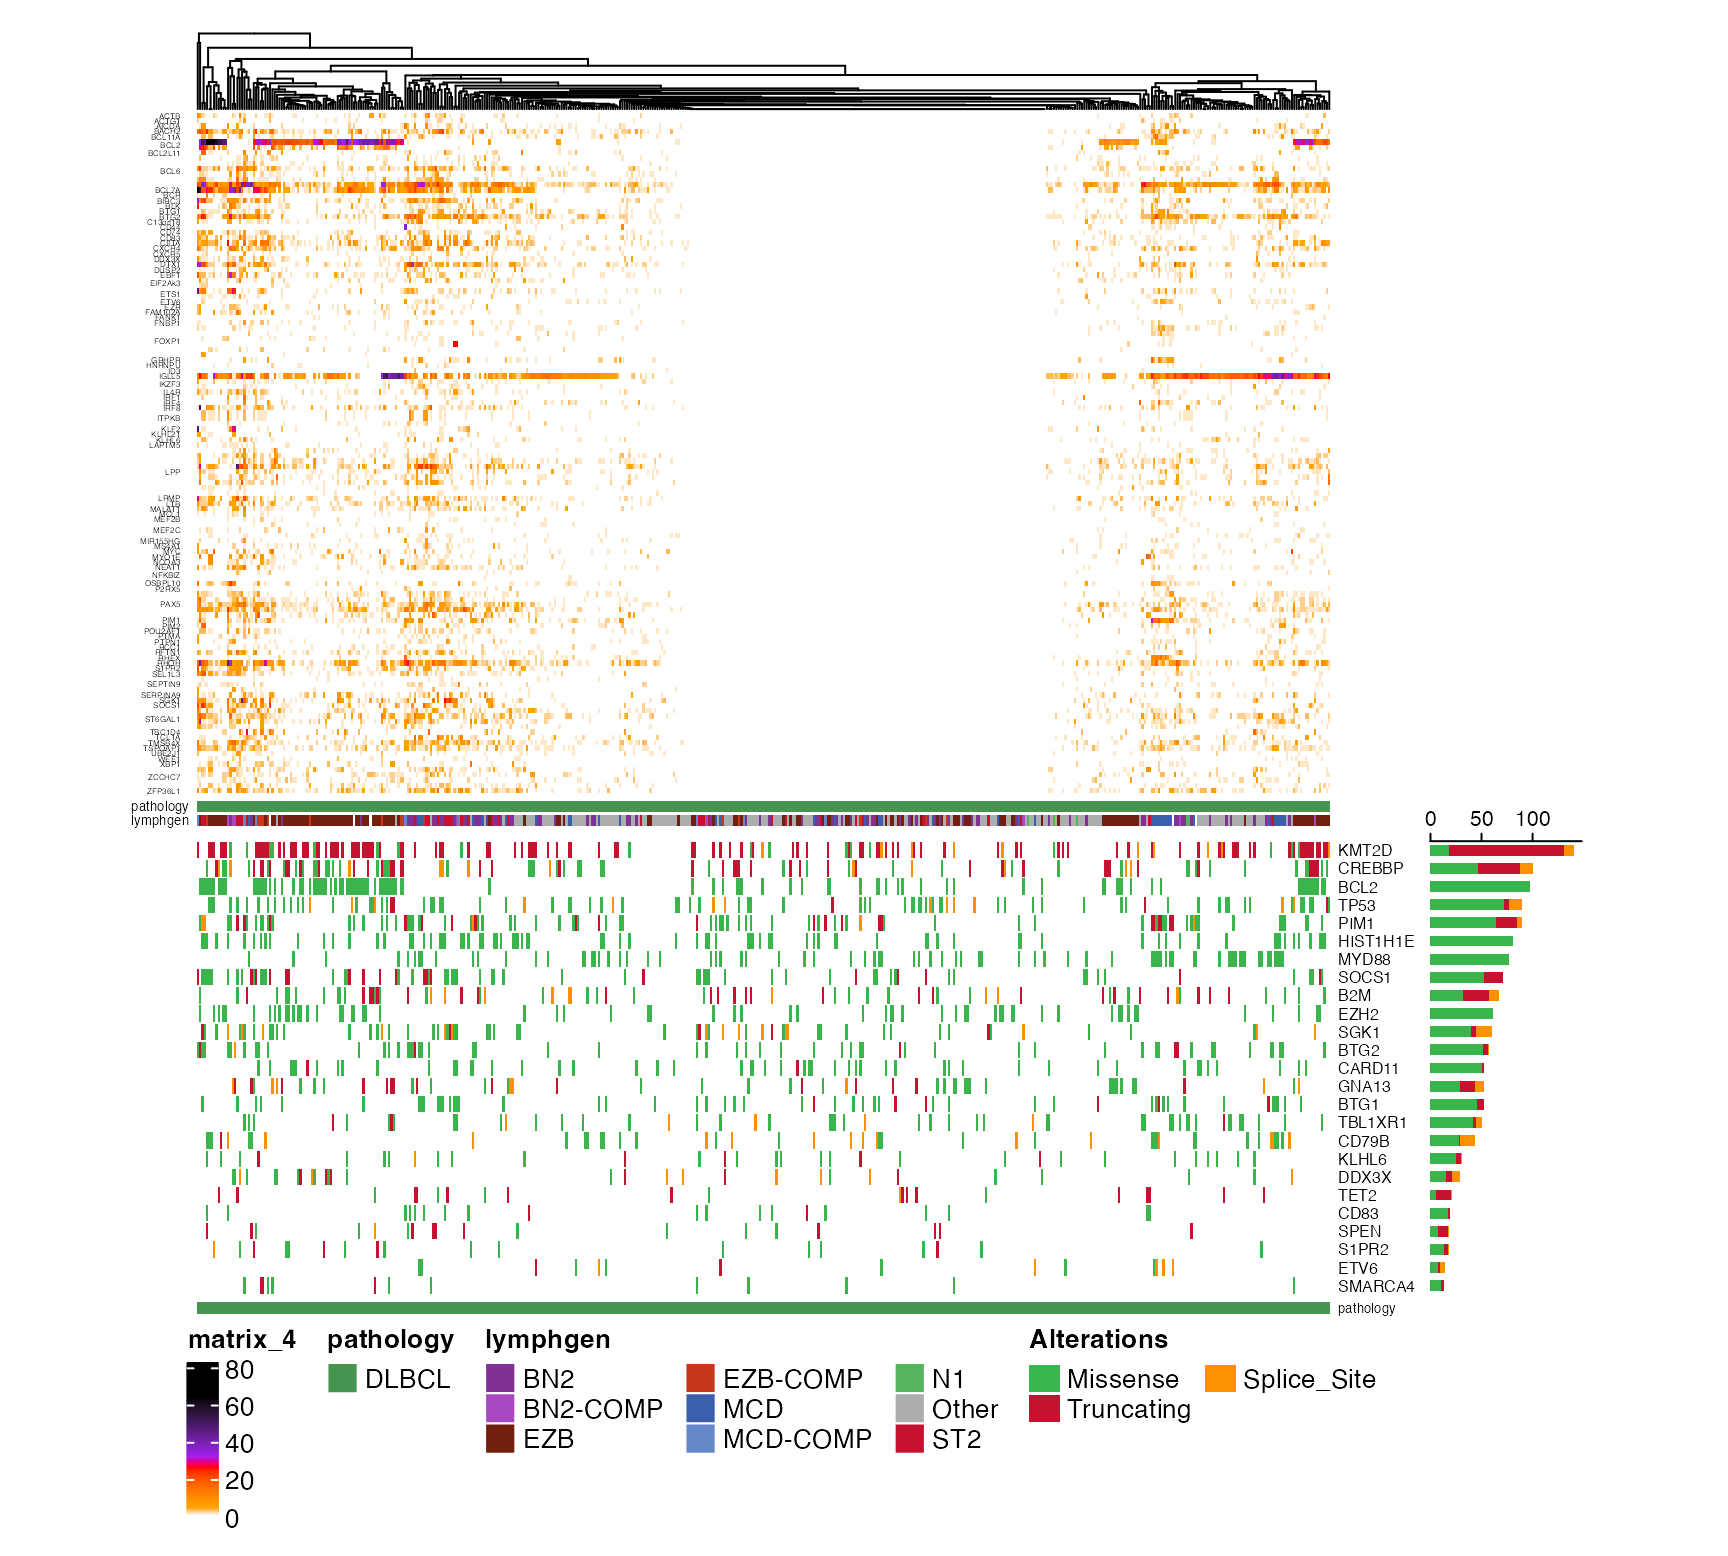
 some_regions = create_bed_data(GAMBLR.data::grch37_ashm_regions,
fix_names = "concat",
concat_cols = c("gene","region"),sep="-")
suppressMessages(
suppressWarnings({
simple_ashm_mat <-
get_ashm_count_matrix(some_regions,
these_samples_metadata = dlbcl_genome_meta)
prettyStackedOncoplot(these_samples_metadata = dlbcl_genome_meta,
maf_data = dlbcl_maf,
regions_bed= some_regions,
metadataColumns = c("pathology","lymphgen"),
oncoplot_location = "bottom",
ashm_matrix = simple_ashm_mat,
secondPlotType = "prettyMutationDensity",
secondPlotArgs = list("merge_genes"=TRUE,
region_fontsize=3),
genes = genes,
cluster_samples = TRUE,
secondPlotHeight = 9)
}))
some_regions = create_bed_data(GAMBLR.data::grch37_ashm_regions,
fix_names = "concat",
concat_cols = c("gene","region"),sep="-")
suppressMessages(
suppressWarnings({
simple_ashm_mat <-
get_ashm_count_matrix(some_regions,
these_samples_metadata = dlbcl_genome_meta)
prettyStackedOncoplot(these_samples_metadata = dlbcl_genome_meta,
maf_data = dlbcl_maf,
regions_bed= some_regions,
metadataColumns = c("pathology","lymphgen"),
oncoplot_location = "bottom",
ashm_matrix = simple_ashm_mat,
secondPlotType = "prettyMutationDensity",
secondPlotArgs = list("merge_genes"=TRUE,
region_fontsize=3),
genes = genes,
cluster_samples = TRUE,
secondPlotHeight = 9)
}))