Chromosome Plot
prettyChromoplot.RdUse GISTIC2.0 scores output to reproduce maftools::chromoplot with more flexibility.
Usage
prettyChromoplot(
  scores_path,
  scores_df,
  labels_bed,
  default_gene_set = "oncogenes",
  genome_build,
  cutoff = 0.5,
  adjust_amps = 0.5,
  adjust_dels = 2.75,
  label_size = 3,
  force_pull = 0,
  segment.curvature = 0.25,
  segment.ncp = 4,
  segment.angle = 25,
  hide_neutral = FALSE,
  verbose = FALSE
)
Arguments
- scores_path
Output file scores.gistic from the run of GISTIC2.0
- scores_df
Optional. Instead of specifying scores_path pass a pre-loaded scores file as a data frame using scores_df
- labels_bed
Optional. A bed_data object specifying the regions to apply labels.
- genome_build
Defines the chr prefix and the coordinates of the default genes to label if `genes_to_label` is not provided. Automatically set if labels_bed is provided
- cutoff
Optional. Used to determine which regions to color as aberrant. Must be float in the range between 0 and 1. The higher the number, the less regions will be considered as aberrant. The default is 0.5.
- adjust_amps
Optional. The value of G-score for highest amplification peak will be multiplied by this value to determine how far up the gene label will be displayed. Default 0.5.
- adjust_dels
Optional. The value of G-score for highest deletion peak will be multiplied by this value to determine how far down the gene label will be displayed. Default 2.75.
- label_size
Optional. The font size for the gene label to be displayed. Default 3.
- force_pull
Optional. How strong the gene name label will be pulled towards a data point. Default 0 (no pulling).
- segment.curvature
Optional. Indicates whether arrow to the data point should be curved. Accepts numeric value, where negative is for left-hand and positive for right-hand curves, and 0 for straight lines. Default 0.25.
- segment.ncp
Optional. Indicates number of control points to make a smoother curve. Higher value allows for more flexibility for the curve. Default 4.
- segment.angle
Optional. Numeric value in the range 0-180, where less than 90 skews control points of the arrow from label to data point toward the start point. Default 25.
- hide_neutral
Optional. Set to TRUE to hide all neutral (insignificant) regions instead of plotting them in grey
Details
This function uses GISTIC2.0 scores to create a chromosome plot, based on a similar plotting function from `maftools`. The only required parameter for this function is `scores`, which is the path to a file with GISTIC2.0 scores. Other parameters are all optional. For a detailed explanation of how to use these, refer to the parameter descriptions.
Examples
suppressMessages(library(GAMBLR.open))
# Bundled output from a GISTIC run using grch37 results
gistic_scores = system.file("extdata",
"scores.gistic",
package="GAMBLR.viz")
suppressMessages(
suppressWarnings({
# Automatic labeling of gene sets for a given pathology
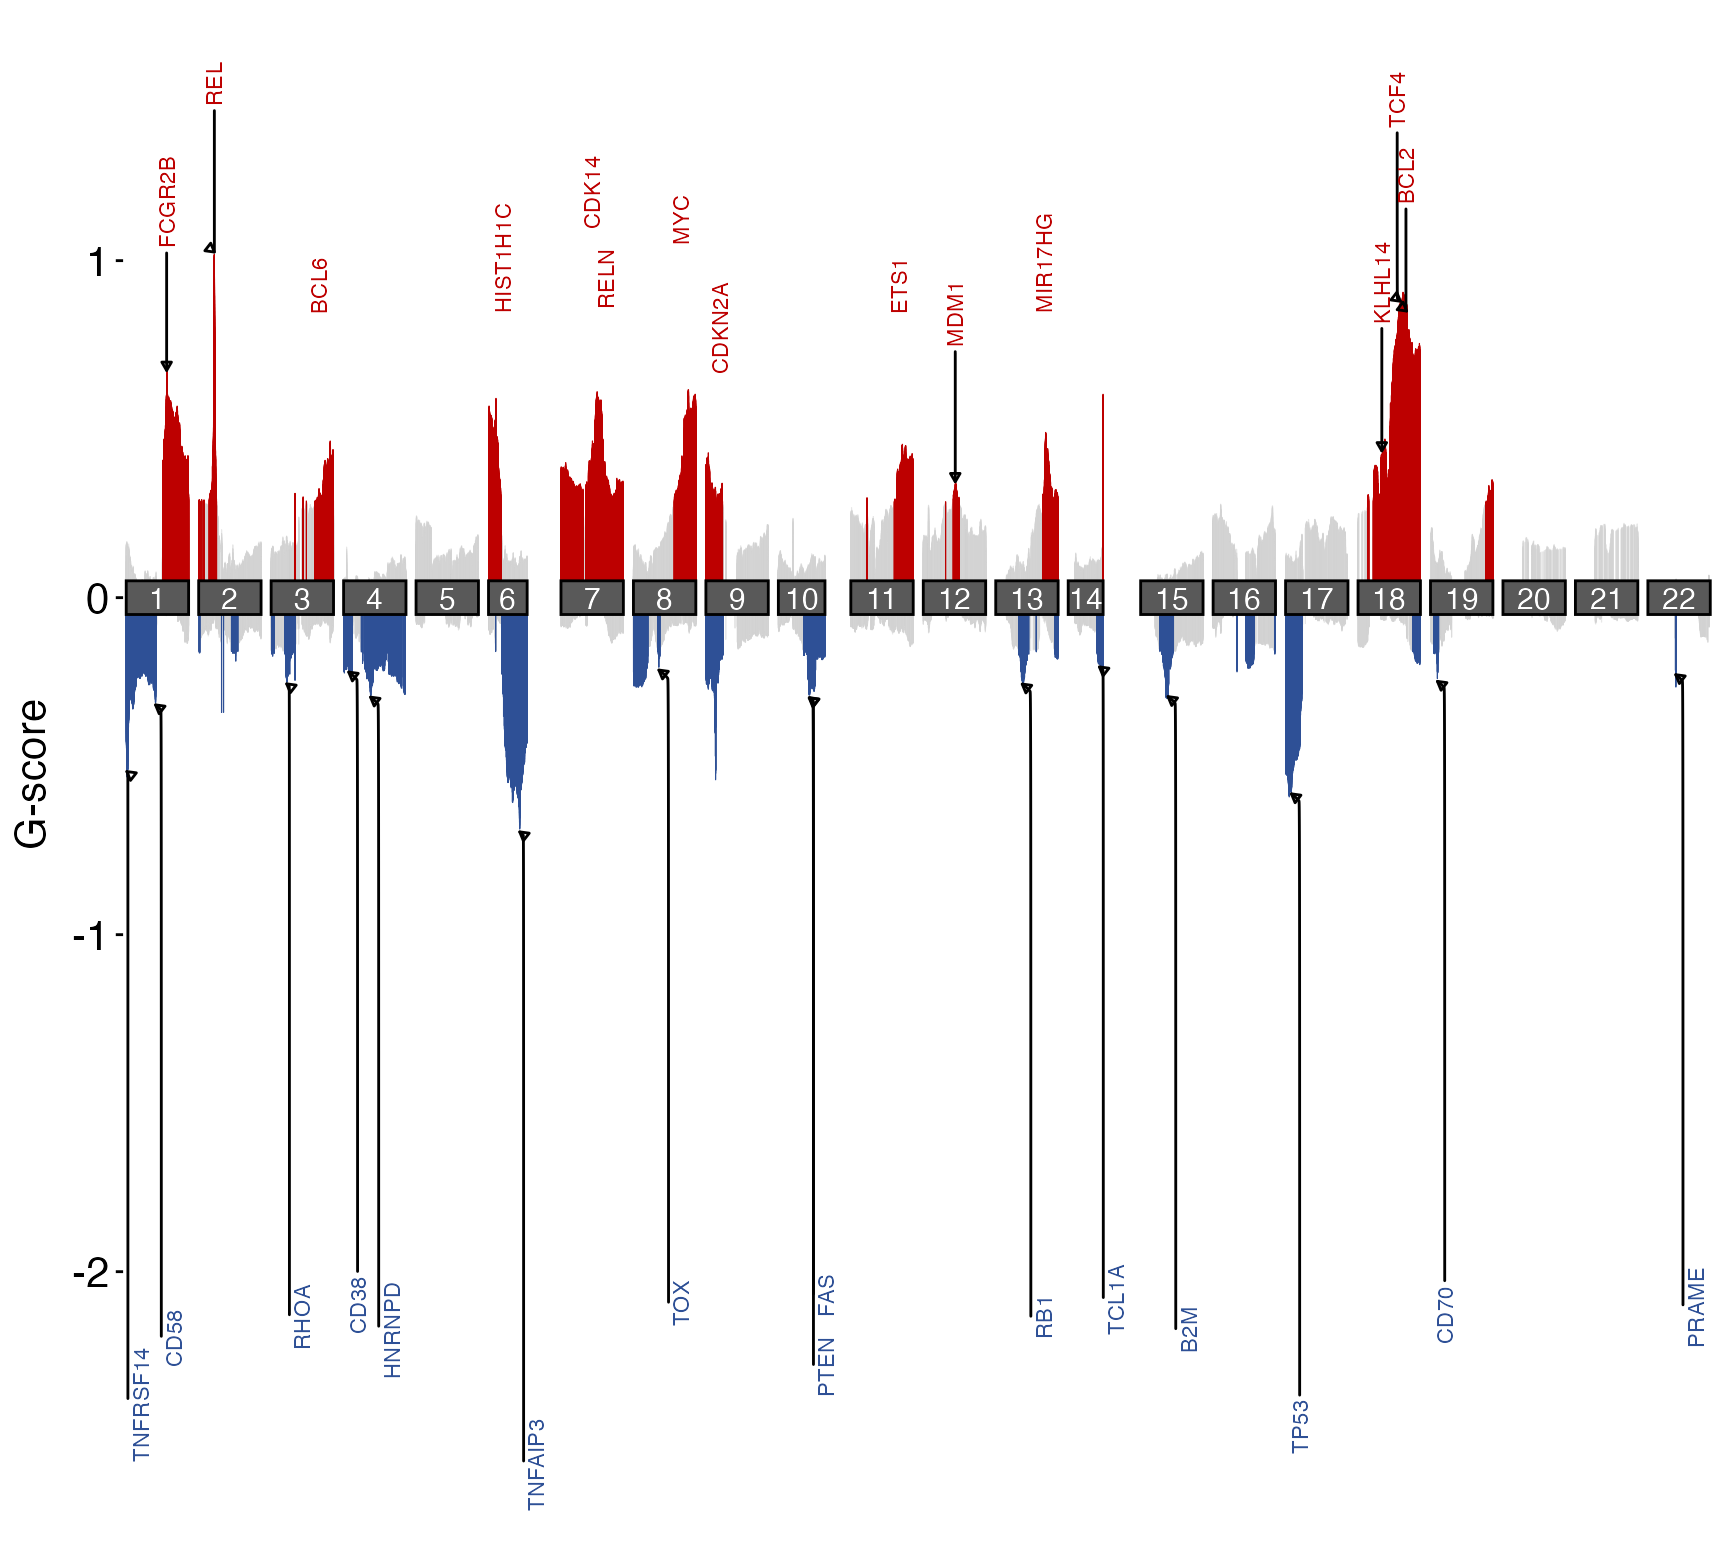
prettyChromoplot(scores_path = gistic_scores,
default_gene_set = "FL",
genome_build = "grch37")
}))
#> Warning: ggrepel: 17 unlabeled data points (too many overlaps). Consider increasing max.overlaps
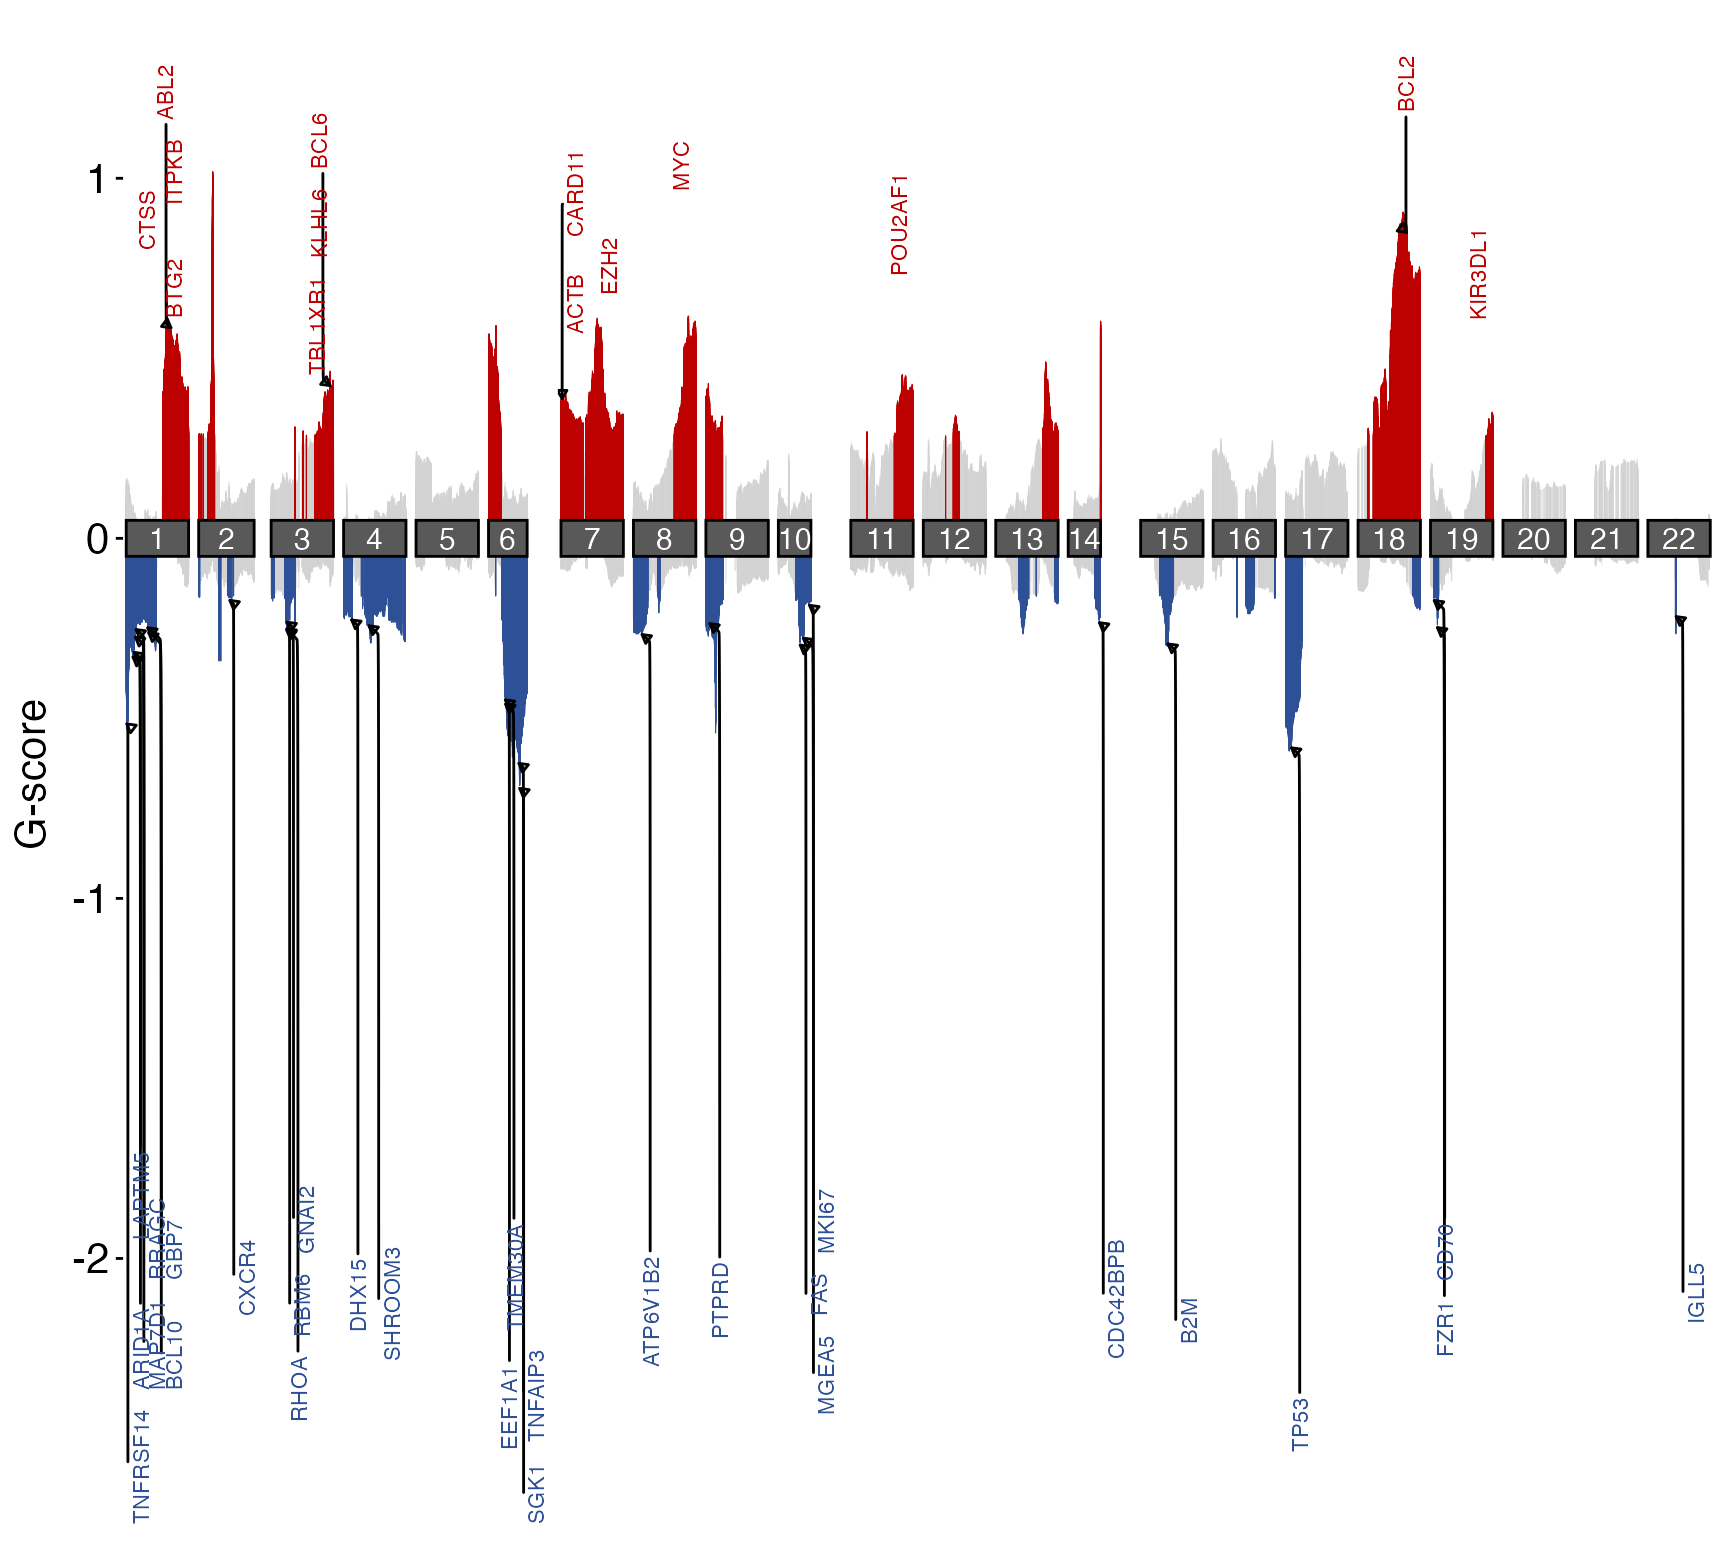 ## Specifying your own gene list for labeling
genes = c(
"MYC","FCGR2B","TNFRSF14","FAS","PTEN","B2M",
"RB1","TCL1A","CD70","TOX","PRAME","CD38",
"BCL2","KLHL14","TCF4","REL","BCL6",
"SMARCA4","CDKN2A","RHOA","HIST1H1C",
"TNFAIP3","TP53","CDK14","RELN","ETS1",
"MDM1","MIR17HG","CD58","HNRNPD"
)
gene_bed = dplyr::select(GAMBLR.data::grch37_gene_coordinates,-1) %>%
#remove ensembl ID column
dplyr::filter(hugo_symbol %in% genes) %>%
#keep genes of interest
dplyr::mutate(length = end - start,mid = start + length/2) %>%
dplyr::mutate(start = mid,end=start+1) %>%
unique() %>%
#convert to bed_data format
GAMBLR.utils::create_bed_data(genome_build = "grch37")
suppressMessages(
suppressWarnings({
prettyChromoplot(scores_path = gistic_scores,
labels_bed = gene_bed)
}))
## Specifying your own gene list for labeling
genes = c(
"MYC","FCGR2B","TNFRSF14","FAS","PTEN","B2M",
"RB1","TCL1A","CD70","TOX","PRAME","CD38",
"BCL2","KLHL14","TCF4","REL","BCL6",
"SMARCA4","CDKN2A","RHOA","HIST1H1C",
"TNFAIP3","TP53","CDK14","RELN","ETS1",
"MDM1","MIR17HG","CD58","HNRNPD"
)
gene_bed = dplyr::select(GAMBLR.data::grch37_gene_coordinates,-1) %>%
#remove ensembl ID column
dplyr::filter(hugo_symbol %in% genes) %>%
#keep genes of interest
dplyr::mutate(length = end - start,mid = start + length/2) %>%
dplyr::mutate(start = mid,end=start+1) %>%
unique() %>%
#convert to bed_data format
GAMBLR.utils::create_bed_data(genome_build = "grch37")
suppressMessages(
suppressWarnings({
prettyChromoplot(scores_path = gistic_scores,
labels_bed = gene_bed)
}))
 #NOTE: genome build is inferred from gene_bed
if (FALSE) { # \dontrun{
# GISTIC run using hg38 data
prettyChromoplot(scores_path=gistic_scores,
cutoff = 0.9,
label_size=2,
adjust_amps = 0.5,
adjust_dels = 0.8,
genome_build="hg38",
hide_neutral = TRUE)
} # }
#NOTE: genome build is inferred from gene_bed
if (FALSE) { # \dontrun{
# GISTIC run using hg38 data
prettyChromoplot(scores_path=gistic_scores,
cutoff = 0.9,
label_size=2,
adjust_amps = 0.5,
adjust_dels = 0.8,
genome_build="hg38",
hide_neutral = TRUE)
} # }